CORZ Indonesia | Research & Studies
Don't Just Measure the Waves—Understand the Energy That Shapes the Coast
Check out some other model outputs on YouTube @CORZIndonesia
A shoreline may appear to be a fixed boundary separating land and sea.
In reality, it is continually adjusting.
At one location, the coastline may retreat through erosion.
Elsewhere, sediment may accumulate and create accretion.
Among the many processes controlling these changes, one of the most important physical drivers is:
WAVES.
Waves transport energy from offshore waters toward the coast.
As they enter shallower water, that energy is transformed through shoaling, refraction, diffraction, breaking, reflection, and interaction with seabed morphology and shoreline geometry.
The key questions are therefore not limited to:
“How high are the waves?”
We also need to ask:
How does wave height vary spatially?
Where is wave-energy exposure greater?
How does the wave field change toward the shoreline?
How can wave energy mobilise and redistribute coastal sediment?
And how might this physical forcing contribute to patterns of erosion and accretion?
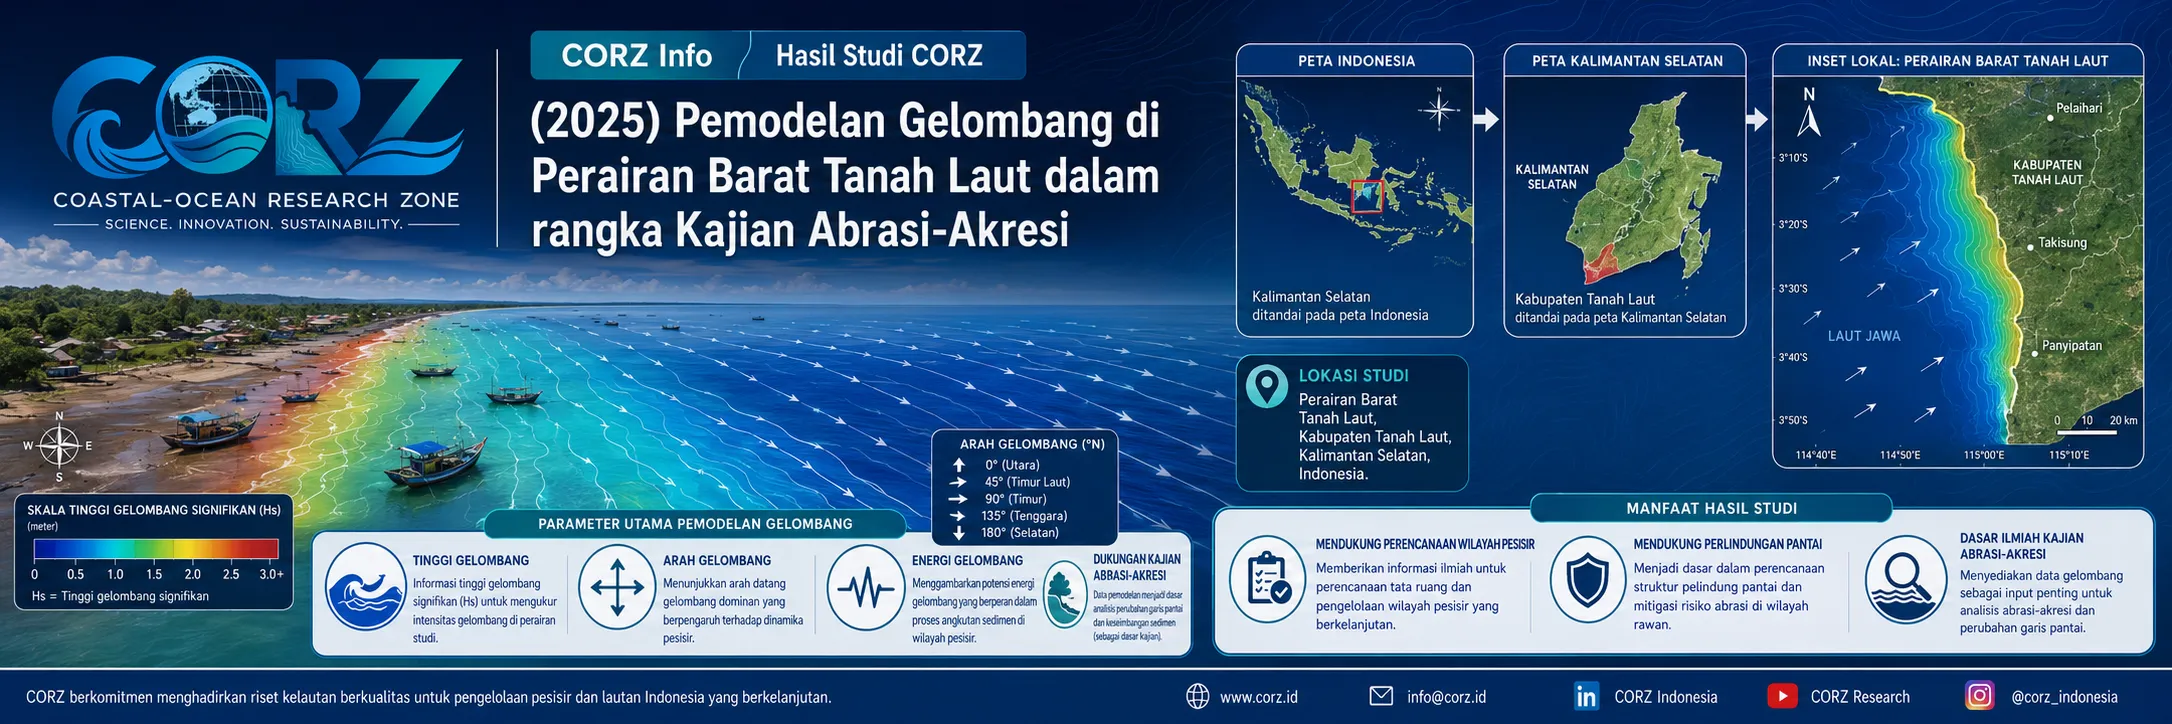
In 2025, CORZ Indonesia conducted Research & Studies involving wave modelling in the western waters of Tanah Laut Regency, South Kalimantan, to support assessment of potential coastal abrasion and accretion.
The modelling included:
- Mean Wave Height
- Significant Wave Height
- Wave Power
Together, these provide three complementary perspectives:
HEIGHT × SEA STATE × ENERGY.
Western Tanah Laut: A Coastline Known to Be Dynamic
Independent scientific research provides a strong foundation for understanding why this study matters.
A peer-reviewed study of the western coast of Tanah Laut Regency used Landsat imagery from 2003 and 2016 and identified both abrasion and accretion. It also described the coast as being physically influenced by Java Sea dynamics and seasonally varying discharge from the Barito River.
Scientific study — Shoreline Change on the Western Coast of Tanah Laut
A separate coastal-vulnerability assessment included mean wave height as one of six key physical parameters, alongside geomorphology, beach slope, tides, relative sea-level change, and shoreline movement.
The context is clear:
SHORELINE CHANGE IS VISIBLE.
The next challenge is to better understand:
THE PHYSICAL PROCESSES BEHIND IT.
- Mean Wave Height — Understanding the Background Wave Climate
The first CORZ modelling component examines:
MEAN WAVE HEIGHT.
Mean wave height provides information about the average wave condition within the period or scenario being analysed.
This perspective matters because shoreline evolution is not produced only by extreme events.
A coast is exposed to wave forcing:
hour after hour,
day after day,
season after season.
Mean wave height therefore contributes information about the:
BACKGROUND WAVE CLIMATE.
The physical pathway is:
WIND / OFFSHORE WAVE CONDITIONS
↓
WAVE GENERATION & PROPAGATION
↓
NEARSHORE TRANSFORMATION
↓
MEAN WAVE-HEIGHT FIELD
↓
BACKGROUND COASTAL EXPOSURE.
- Significant Wave Height — Characterising the Sea State
The second component examines:
SIGNIFICANT WAVE HEIGHT — Hs.
Significant Wave Height is one of the most widely used parameters for describing ocean-wave conditions.
In its classical statistical interpretation, Hs corresponds approximately to the average height of the highest one-third of waves in a record.
Why is that useful?
Because a real sea contains a spectrum of waves with different heights and periods.
The maximum wave alone is not representative.
The simple mean tells only part of the story.
Hs provides a widely understood measure of:
SEA STATE.
For coastal analysis, greater Hs generally represents more energetic wave conditions.
However:
HIGH Hs ≠ AUTOMATICALLY HIGH EROSION.
The shoreline response also depends on:
wave direction • wave period • sediment size • beach slope • bathymetry • currents • tides • river sediment supply • coastal structures • vegetation • sea-level conditions.
This distinction is essential for credible coastal modelling.
- Wave Power — Following the Energy toward the Coast
The third component moves beyond height:
WAVE POWER.
Wave height asks:
“How high is the wave?”
Wave power adds:
“How much wave energy is being transported?”
This is particularly valuable when examining coastal morphology.
A wave is not simply a moving shape on the water surface.
It is a:
TRANSPORT MECHANISM FOR ENERGY.
As waves approach the shoreline:
OFFSHORE ENERGY
↓
PROPAGATION
↓
SHOALING & REFRACTION
↓
BREAKING
↓
ENERGY DISSIPATION
↓
NEARSHORE CIRCULATION
↓
SEDIMENT MOBILISATION & TRANSPORT
↓
SHORELINE RESPONSE.
Why Wave Power Adds Another Dimension
Two coastal locations may experience apparently similar wave heights.
That does not necessarily mean their energy exposure is identical.
Differences in:
wave period • direction • depth • transformation • energy flux
can produce different physical effects.
This is why:
WAVE HEIGHT TELLS THE HEIGHT STORY.
WAVE POWER TELLS THE ENERGY STORY.
Together, they create a stronger physical basis for investigating abrasion and accretion.
Three Parameters, Three Perspectives
| Parameter | Core Question | Interpretation |
| Mean Wave Height | What is the average wave environment? | Background wave climate |
| Significant Wave Height | What is the representative energetic sea state? | Sea-state characterisation |
| Wave Power | How much wave energy is being transported? | Coastal energy exposure |
Together:
HEIGHT
SEA STATE
ENERGY
↓
A MORE COMPLETE WAVE-CLIMATE PICTURE.
Connecting Wave Modelling with Shoreline Change
Wave modelling by itself does not automatically provide an erosion rate in metres per year.
A comprehensive abrasion–accretion assessment requires additional information including:
historical shoreline position • sediment properties • bathymetry • beach morphology • currents • tides • river sediment supply • coastal structures.
The stronger framework is:
WAVE MODELLING
↓
HEIGHT + DIRECTION + ENERGY
↓
COASTAL EXPOSURE
↔
OBSERVED SHORELINE CHANGE
↓
ABRASION–ACCRETION INTERPRETATION.
This connects:
WHAT THE COAST DID
with:
WHAT PHYSICAL FORCING ACTED UPON IT.
Previous Research Confirms Both Abrasion and Accretion
Scientific analysis of western Tanah Laut has demonstrated that shoreline change does not follow a single pattern.
Some parts of the coast experienced accretion while others experienced abrasion. The system is also influenced by seasonal Java Sea dynamics and sediment-related processes associated with the Barito River.
Research at Takisung has also used numerical wave-transformation modelling to investigate coastal-protection configurations involving breakwaters, groins, and revetments, illustrating the direct relevance of wave transformation to engineering decisions on this coastline.
Mainstream Media Have Documented the Abrasion Problem for Years
The coastal issue is not only visible in academic studies.
ANTARA reported severe abrasion at Takisung Beach in Tanah Laut as early as 2011. Provincial authorities linked accelerated coastal damage to extreme weather and larger waves, while gabion structures were being constructed in an attempt to reduce wave attack.
ANTARA — Extreme Weather Accelerates Coastal Abrasion in South Kalimantan
This report was not related to the CORZ 2025 modelling study.
Its value is historical: the interaction between waves and coastal erosion has long been a practical concern along the Tanah Laut coastline.
2025: Coastal Protection Moves toward Hybrid Engineering
The connection becomes even more relevant in 2025.
ANTARA reported that South Kalimantan's Marine and Fisheries Agency implemented a hybrid-engineering demonstration project at Pagatan Besar, Takisung District, Tanah Laut. The approach combines environmentally friendly physical structures with ecosystem rehabilitation to strengthen resistance to abrasion, tidal flooding, and sea-level rise.
ANTARA — Hybrid Engineering for Coastal Rehabilitation at Pagatan Besar, Tanah Laut
Again, this report was not about the CORZ study.
But the timing is highly relevant.
During the same year that coastal managers were testing new approaches to abrasion mitigation, CORZ was investigating the:
WAVE HEIGHT AND WAVE ENERGY
that form part of the physical environment those interventions must withstand.
Understand the Process Before Selecting the Protection
Coastal protection should ideally begin with the process rather than the structure.
A breakwater may be appropriate in one area.
Nature-based or hybrid engineering may work better elsewhere.
A poorly understood intervention can even modify sediment transport and create unintended erosion downstream.
A more defensible sequence is:
UNDERSTAND THE WAVE CLIMATE
↓
UNDERSTAND SEDIMENT TRANSPORT
↓
MAP ABRASION & ACCRETION
↓
ASSESS VULNERABILITY
↓
TEST MITIGATION SCENARIOS
↓
SELECT THE APPROPRIATE COASTAL INTERVENTION.
This is where process-based numerical modelling becomes valuable.
Waves Do Not Only Erode—They Redistribute Sediment
Coastal abrasion is sometimes simplified as:
waves hitting the shoreline.
The actual process is more complex.
Wave breaking can generate currents.
Those currents can mobilise sediment.
Sediment can then be transported:
alongshore
or:
cross-shore.
The sequence may become:
EROSION
↓
TRANSPORT
↓
DEPOSITION
↓
ACCRETION ELSEWHERE.
This means that erosion and accretion are connected through the:
COASTAL SEDIMENT BUDGET.
The Barito River Adds Another Layer of Complexity
Western Tanah Laut is influenced not only by the Java Sea.
It also lies within the influence of a major estuarine system.
Scientific research on the region identifies seasonal interactions involving Java Sea oceanography and Barito River discharge, meaning shoreline behaviour can reflect both marine forcing and terrestrial sediment supply.
Conceptually:
RIVER SEDIMENT SUPPLY
↘
COASTAL SEDIMENT BUDGET
↗
WAVE & CURRENT TRANSPORT.
This is precisely why wave height alone cannot explain every shoreline change.
Mean Wave Height + Hs + Wave Power = Wave Exposure Intelligence
The strength of the CORZ 2025 approach lies in examining multiple layers.
MEAN WAVE HEIGHT
provides the average condition.
SIGNIFICANT WAVE HEIGHT
describes the representative energetic sea state.
WAVE POWER
describes energy transport.
Mapped spatially:
MEAN WAVE HEIGHT
SIGNIFICANT WAVE HEIGHT
WAVE POWER
↓
WAVE-EXPOSURE INFORMATION
which can then be compared against:
SHORELINE-CHANGE INFORMATION.
This is the transformation:
DATA → MODEL → PROCESS → COASTAL UNDERSTANDING.
From Coloured Maps to Coastal Decision Support
A wave model may be visualised as a beautiful colour map.
The purpose, however, is not the colour.
The purpose is the information behind it.
Modelling can help identify:
areas of relatively greater wave exposure;
differences in wave-energy conditions between coastal segments;
locations requiring more detailed assessment;
areas where shoreline change should be compared with wave forcing;
and:
priority zones for survey, monitoring, or mitigation studies.
A:
WAVE MAP
can therefore become:
COASTAL-PROCESS INFORMATION
and eventually:
COASTAL DECISION SUPPORT.
Numerical Modelling Works Best as Part of an Integrated Assessment
For a comprehensive coastal-change study, wave modelling can be integrated with:
SATELLITE SHORELINE ANALYSIS
FIELD OBSERVATION
SEDIMENT CHARACTERISTICS
BATHYMETRY
SEA-LEVEL CHANGE
LAND SUBSIDENCE, WHERE RELEVANT
HYDRODYNAMICS
WAVE MODELLING
↓
INTEGRATED COASTAL ASSESSMENT.
Because shoreline change is rarely controlled by a single variable.
From Reconstructing the Past to Anticipating the Future
Satellite imagery can tell us:
What happened to the shoreline?
Wave modelling helps explain:
What physical forcing acted on it?
Sediment and morphological modelling can then ask:
What could happen next under a particular scenario?
The progression becomes:
PAST → shoreline reconstruction
PRESENT → hydrodynamic and wave analysis
FUTURE → scenario modelling.
This is the pathway toward:
ANTICIPATORY COASTAL MANAGEMENT.
From Abrasion Assessment to Coastal Resilience
Ultimately, the objective should go beyond identifying erosion.
Coastal science needs to support questions such as:
Does this shoreline require intervention?
Which type of intervention is appropriate?
Can nature-based protection work here?
Would hybrid engineering be effective?
Where should structures be located?
How might they alter sediment transport?
Could protecting one section create erosion somewhere else?
The management cycle becomes:
UNDERSTAND
↓
MODEL
↓
COMPARE
↓
DESIGN
↓
MONITOR
↓
ADAPT.
That is the foundation of:
COASTAL RESILIENCE.
Don't Just Measure the Waves. Understand the Energy That Shapes the Coast.
A coastline does not change without physical processes.
Waves transport energy.
Energy moves water.
Moving water mobilises sediment.
Sediment redistribution reshapes the shoreline.
The 2025 Western Tanah Laut study reflects the CORZ Indonesia Research & Studies approach:
Model the Mean Wave Height.
Map the Significant Waves.
Calculate the Wave Power.
Understand the Energy Pathway.
Connect Waves with Sediment Dynamics.
Compare with Shoreline Change.
Identify Coastal Vulnerability.
Support Better Coastal Decisions.
Because the important question is not only:
“How high are the waves?”
It is:
“How much energy reaches the coast—and what could that energy do to the shoreline?”
CORZ Indonesia for Research & Studies
Spectral Wave Modelling • Mean Wave Height • Significant Wave Height • Wave Power • Shoreline Change • Abrasion–Accretion Assessment • Coastal Engineering • Coastal Resilience
Coastal-Ocean Research Zone (CORZ) Indonesia provides research, modelling, analysis, and technical solutions for coastal and ocean environments.
YouTube — CORZ Indonesia
Website — CORZ Indonesia
Email: info@corz.co.id
© 2026 CORZ Indonesia. All Rights Reserved.