CONTEXTField conditions and systems being assessed
Enter at least two characters.
The potential of coastal and marine resources varies greatly from one region to another. Each region has its own strengths and limitations. Likewise, the coastal and marine problems that may arise in each…
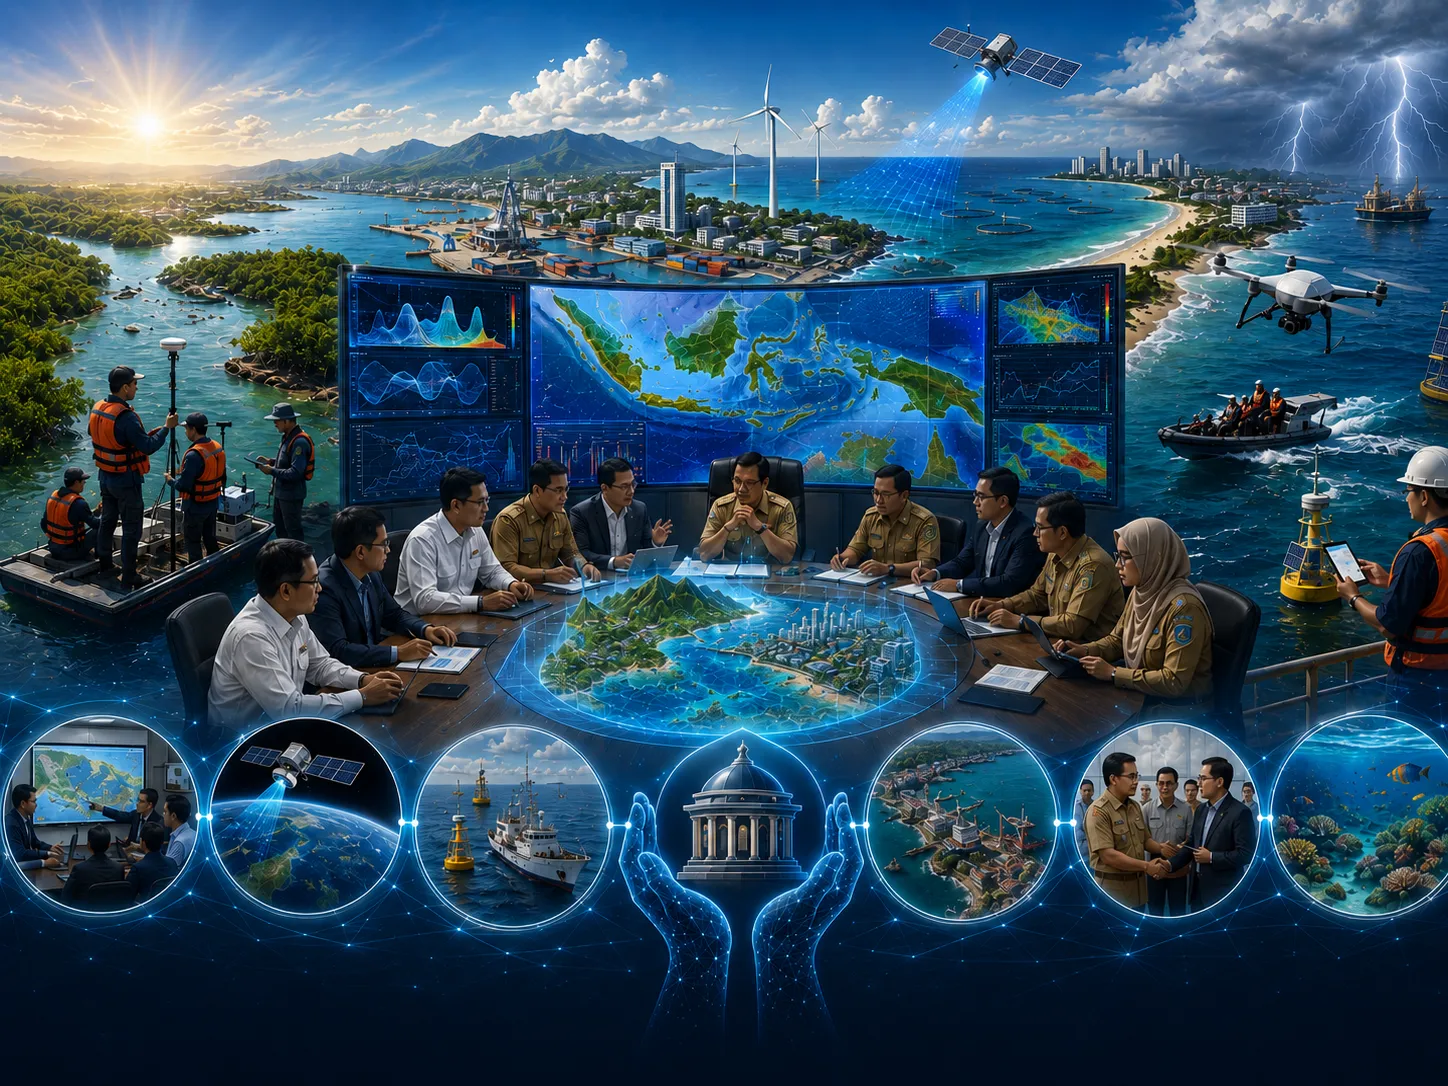
This page includes a one-page leaflet that can be opened in a full-image popup. It helps present the core CORZ service clearly and convincingly during project discussions, executive briefings, and decision-support meetings.
With a more proportional balance between visuals and text, the page feels brighter and more energetic while still keeping the important technical context visible and easy to understand.
Use this leaflet as a concise visual entry point before moving into the more detailed technical explanation.
Clarity before a decision is made
The potential of coastal and marine resources varies greatly from one region to another. Each region has its own strengths and limitations.
Comprehensive problem identification and management need to be carried out before planning is developed. Prevention can be implemented quickly if appropriate and wise local regulations are in place.
Define the approach, priorities, and actions for government support using traceable evidence.
Ambiguous scope, unsuitable outputs, and ineffective multi-party coordination.
Objectives, roles, methods, schedule, and deliverables agreed from the start.
This aspect is assessed to clarify its implications for government support.
This aspect is assessed to clarify its implications for government support.
This aspect is assessed to clarify its implications for government support.
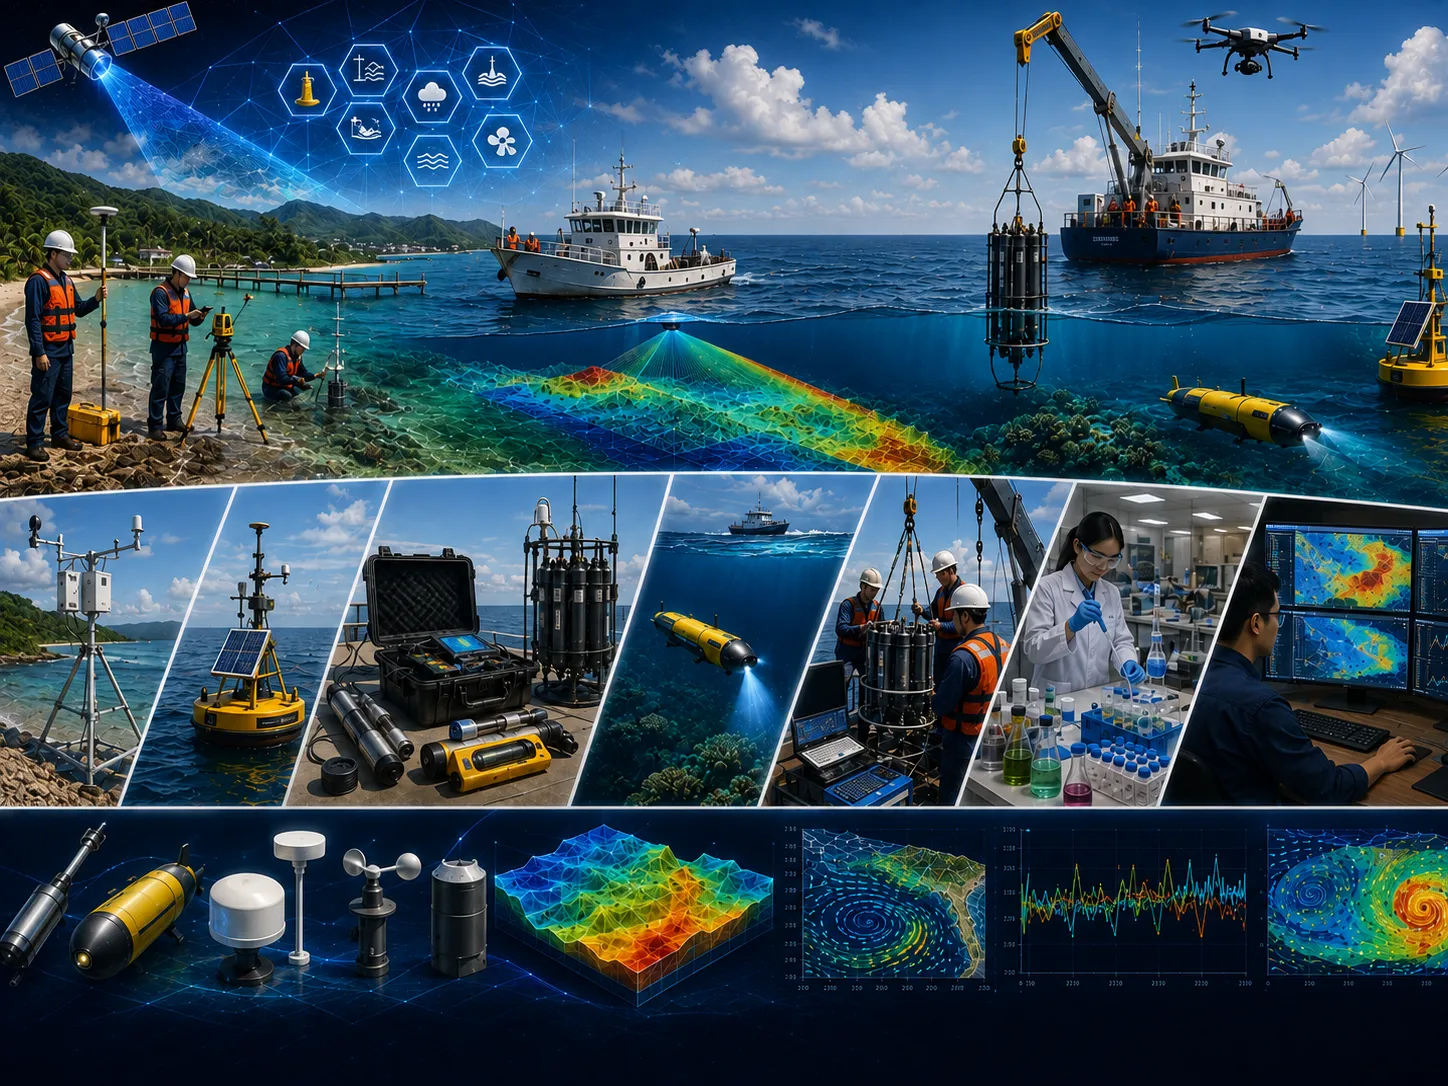
This aspect is assessed to clarify its implications for government support.
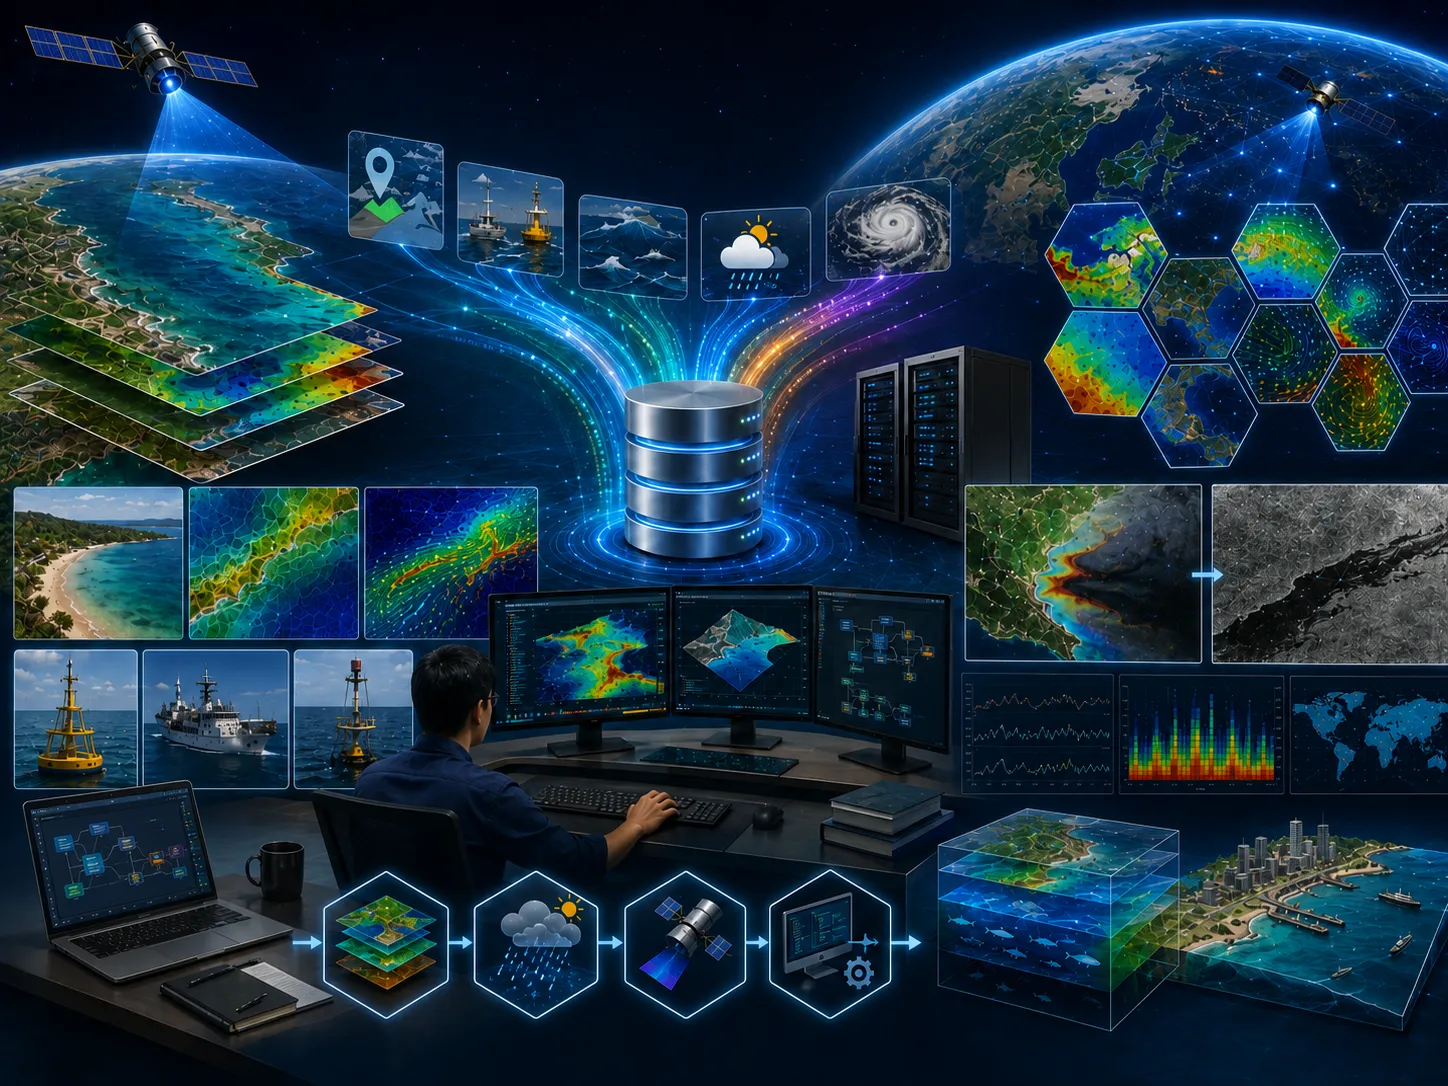
This aspect is assessed to clarify its implications for government support.

This aspect is assessed to clarify its implications for government support.
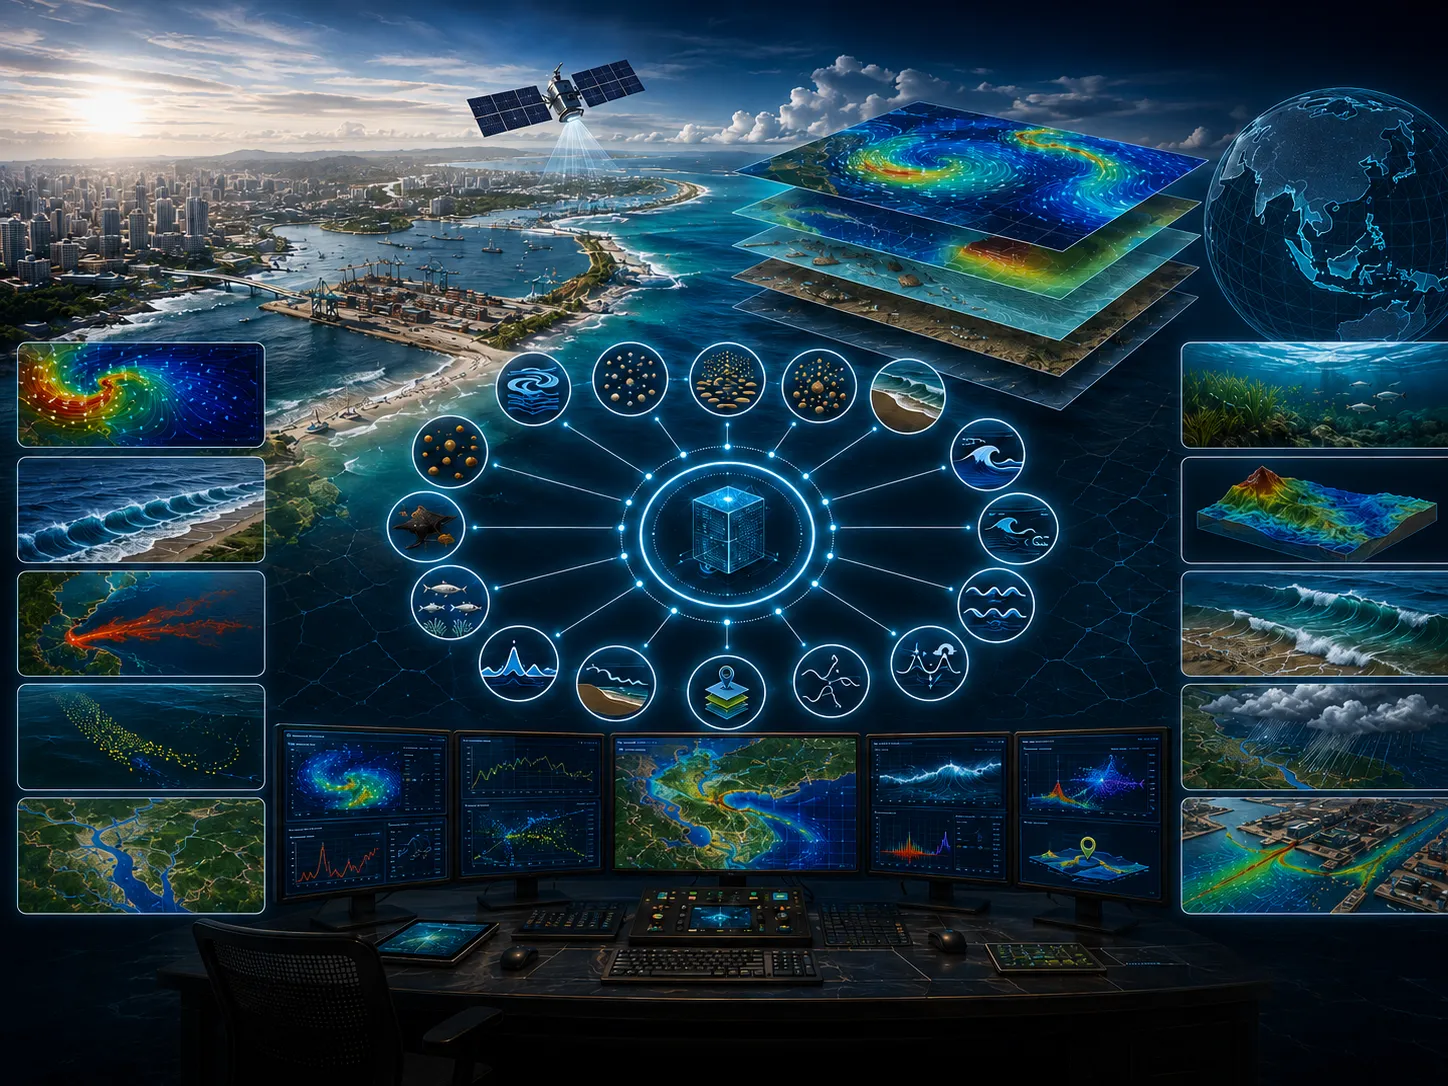
Field surveys, in-situ measurements, laboratory results, historical records, and operating information as required.
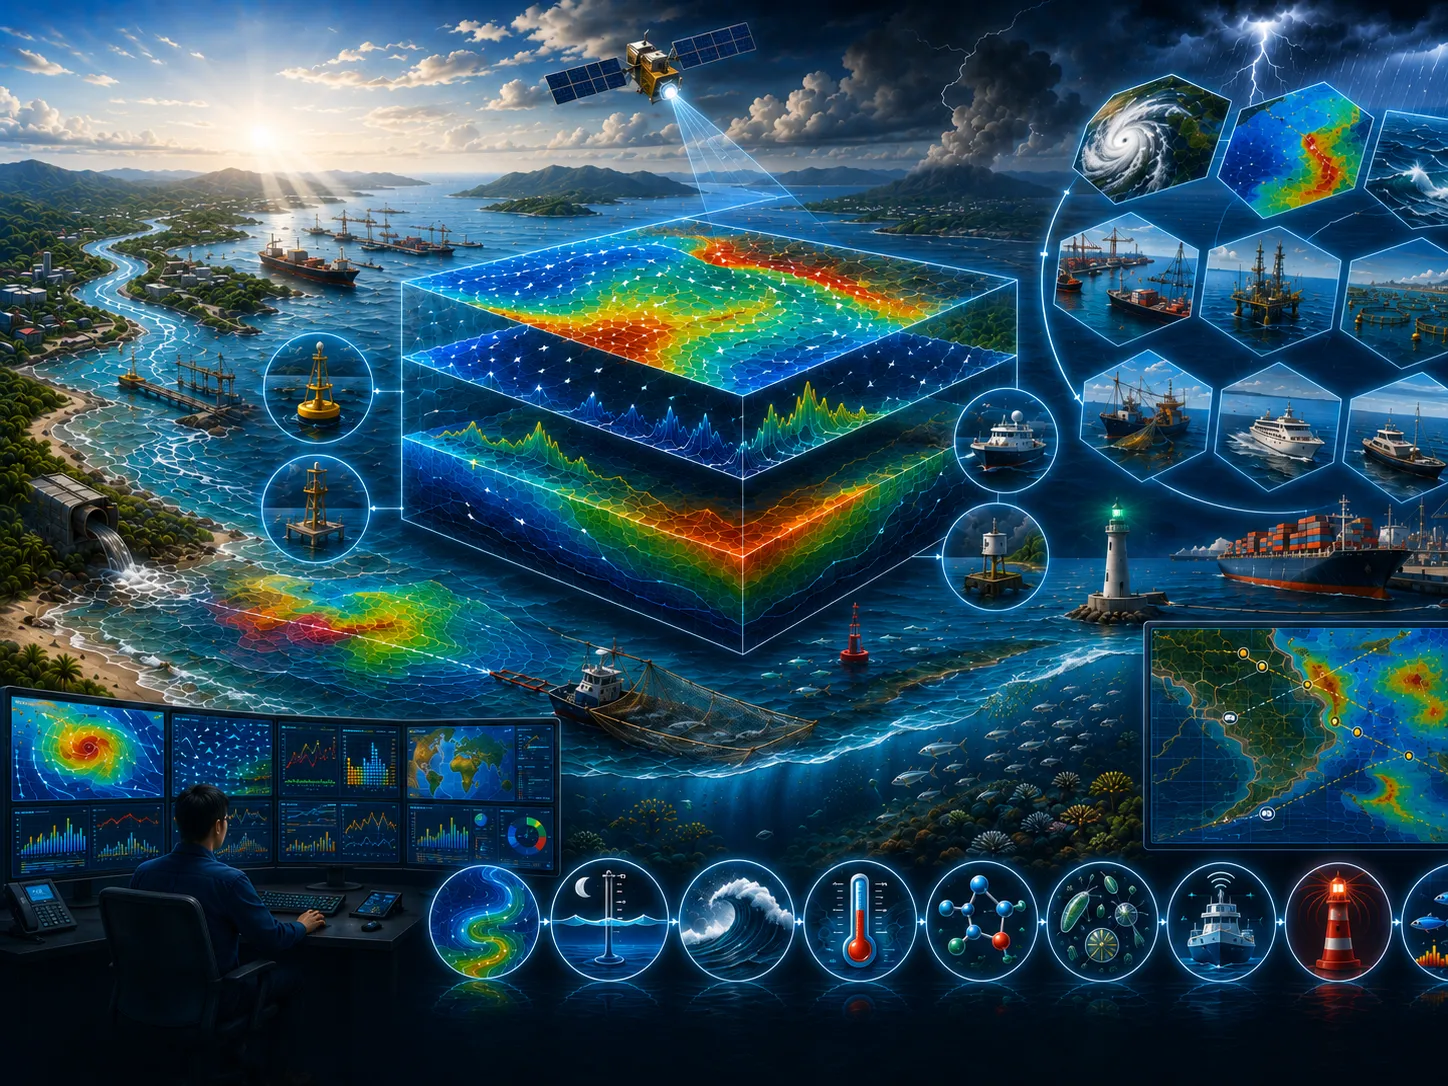
Satellite imagery, mapping, spatial analysis, temporal change, and integration of multiple data sources.
Model setup, calibration, validation, existing–planned–extreme scenarios, and sensitivity analysis.
Metadata, quality controls, assumptions, limitations, data versions, and processing lineage are documented.
Objectives, study area, available data, additional needs, initial risks, and recommended level of detail.
Quality-controlled data, thematic maps, time series, indicators, and comparable visualizations.
Comparison of existing conditions, alternatives, extremes, sensitivities, consequences, and mitigation options.
Methods, results, limitations, recommendations, action priorities, and stakeholder presentation materials.
Assumptions, data, variability, and limitations are stated so decision risk is not hidden.
Alternative locations, designs, operations, or policies are assessed using consistent indicators.
Data needs and analysis depth are proportionate to risk so resources are used efficiently.
Findings and recommendations are transparent for technical, management, regulatory, and partner review.
Objectives, users, location, project phase, problems, constraints, and the decision to support.
Methods, data, surveys, models, schedule, team, deliverables, review gates, and resource estimate.
Collection, inspection, harmonization, documentation, and data-sufficiency assessment.
Processing, modeling, validation, option comparison, sensitivity, and risk evaluation.
Maps, report, executive brief, presentation, supporting data, and follow-up plan.
The potential of coastal and marine resources varies greatly from one region to another. Each region has its own strengths and limitations. Likewise, the coastal and marine problems that may arise in each region will also differ. In addition, the use of coastal and marine areas by human activities and marine industries can make the management of local coastal and marine resources more complex. Poor planning, delayed prevention, inappropriate response, and unsuitable policy decisions in managing coastal and marine resources and addressing related problems can become major obstacles for decision-makers.
Comprehensive problem identification and management need to be carried out before planning is developed. Prevention can be implemented quickly if appropriate and wise local regulations are in place. Response efforts will be successful if suitable standard procedures or protocols are available. Policy decisions can be made effectively when they are supported by reliable scientific evidence and facts obtained through proper studies and assessments. If this cycle can be carried out properly, it will create significant positive impacts on the economy and the sustainability of the aquatic environment in the region. Local revenue may increase through greater contributions from the coastal and marine sectors, while the success rate of businesses operating in coastal and marine areas may also improve. Ultimately, the coastal and marine sector can become a leading sector in the region.
All of the processes described above can run effectively if local governments have the willingness and commitment to give greater attention to their coastal and marine areas as valuable resource potential. Therefore, all problems related to coastal and marine areas should become priorities to be addressed quickly and appropriately. These problems commonly involve pollution, environmental degradation, coastal and marine management policies, natural phenomena, and other related issues.
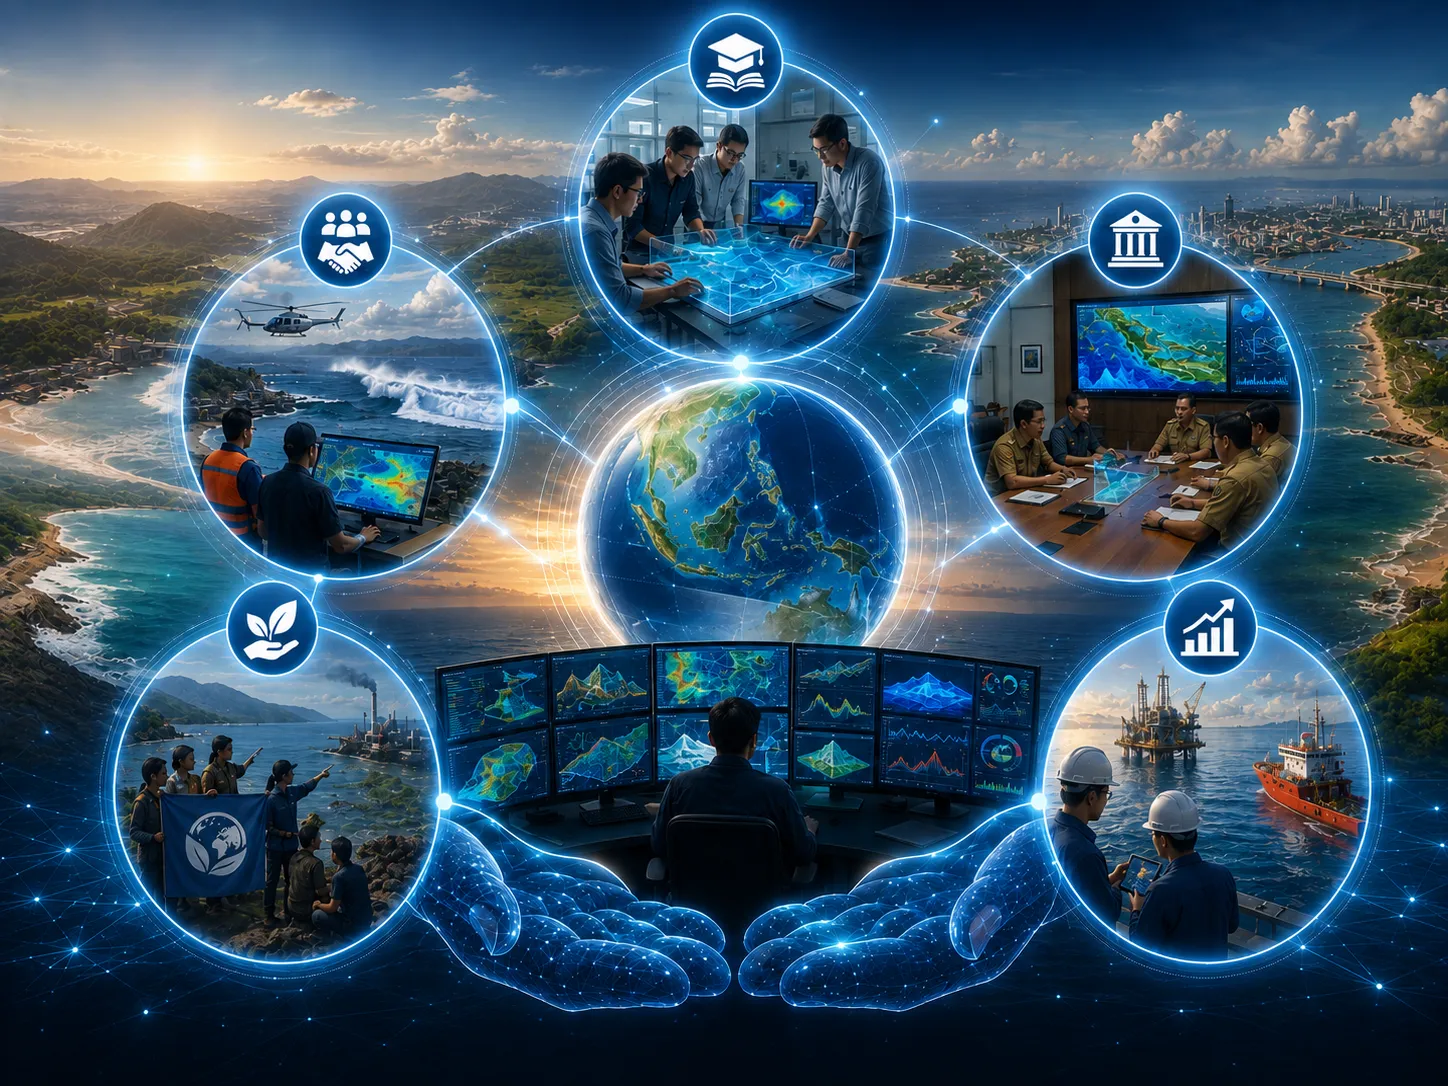
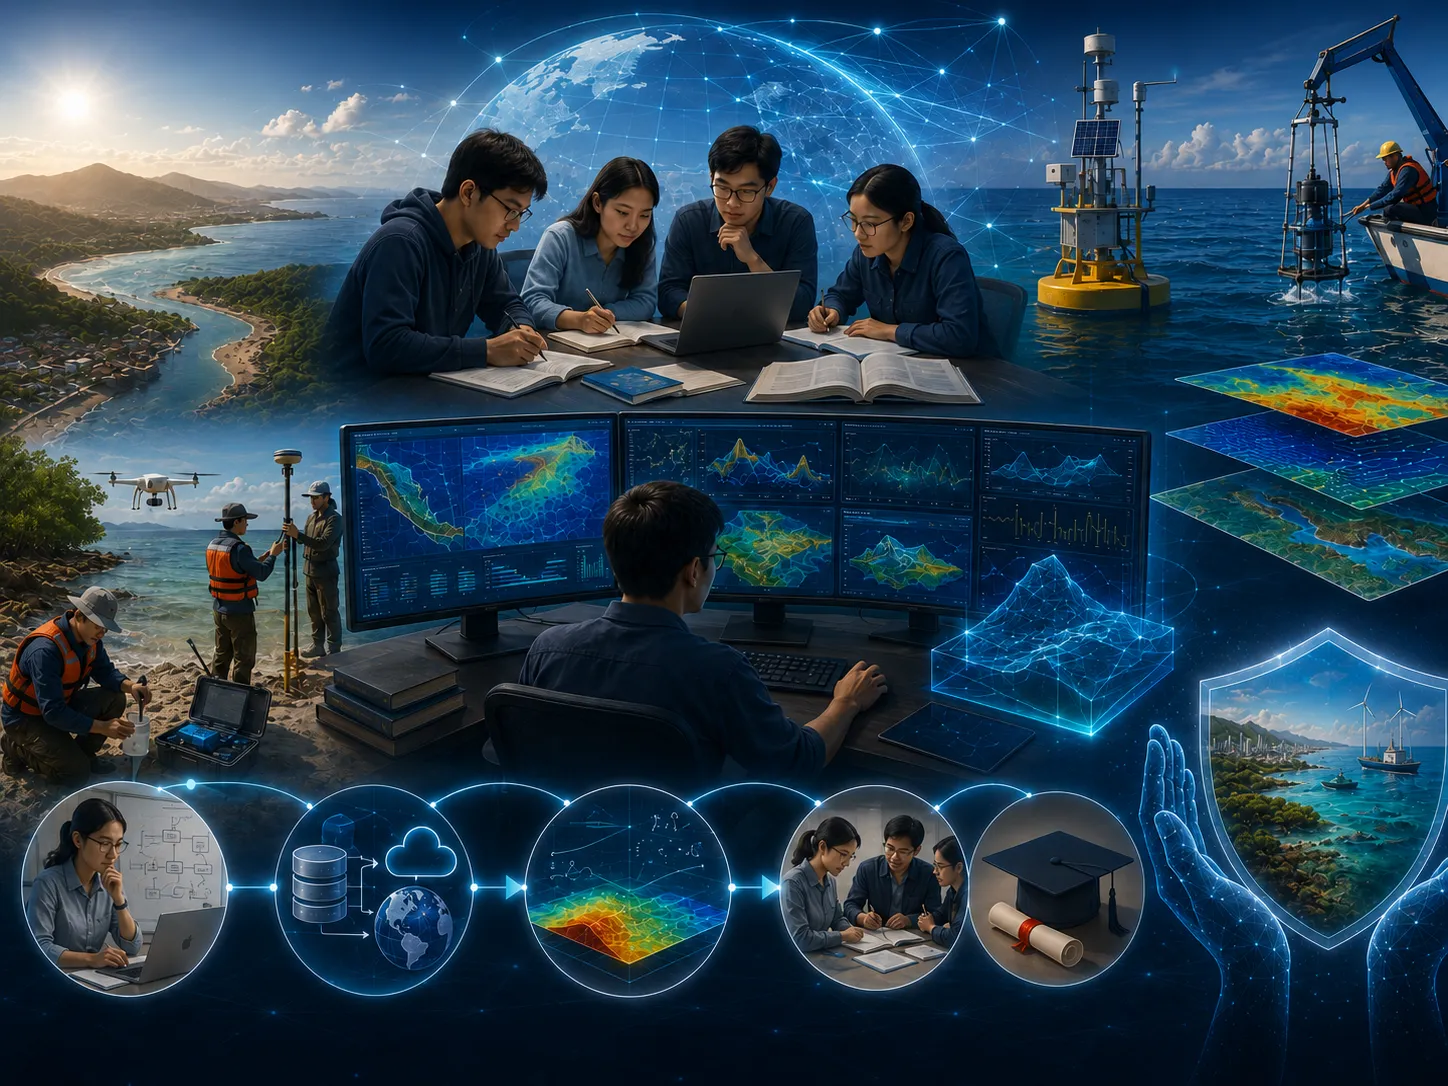
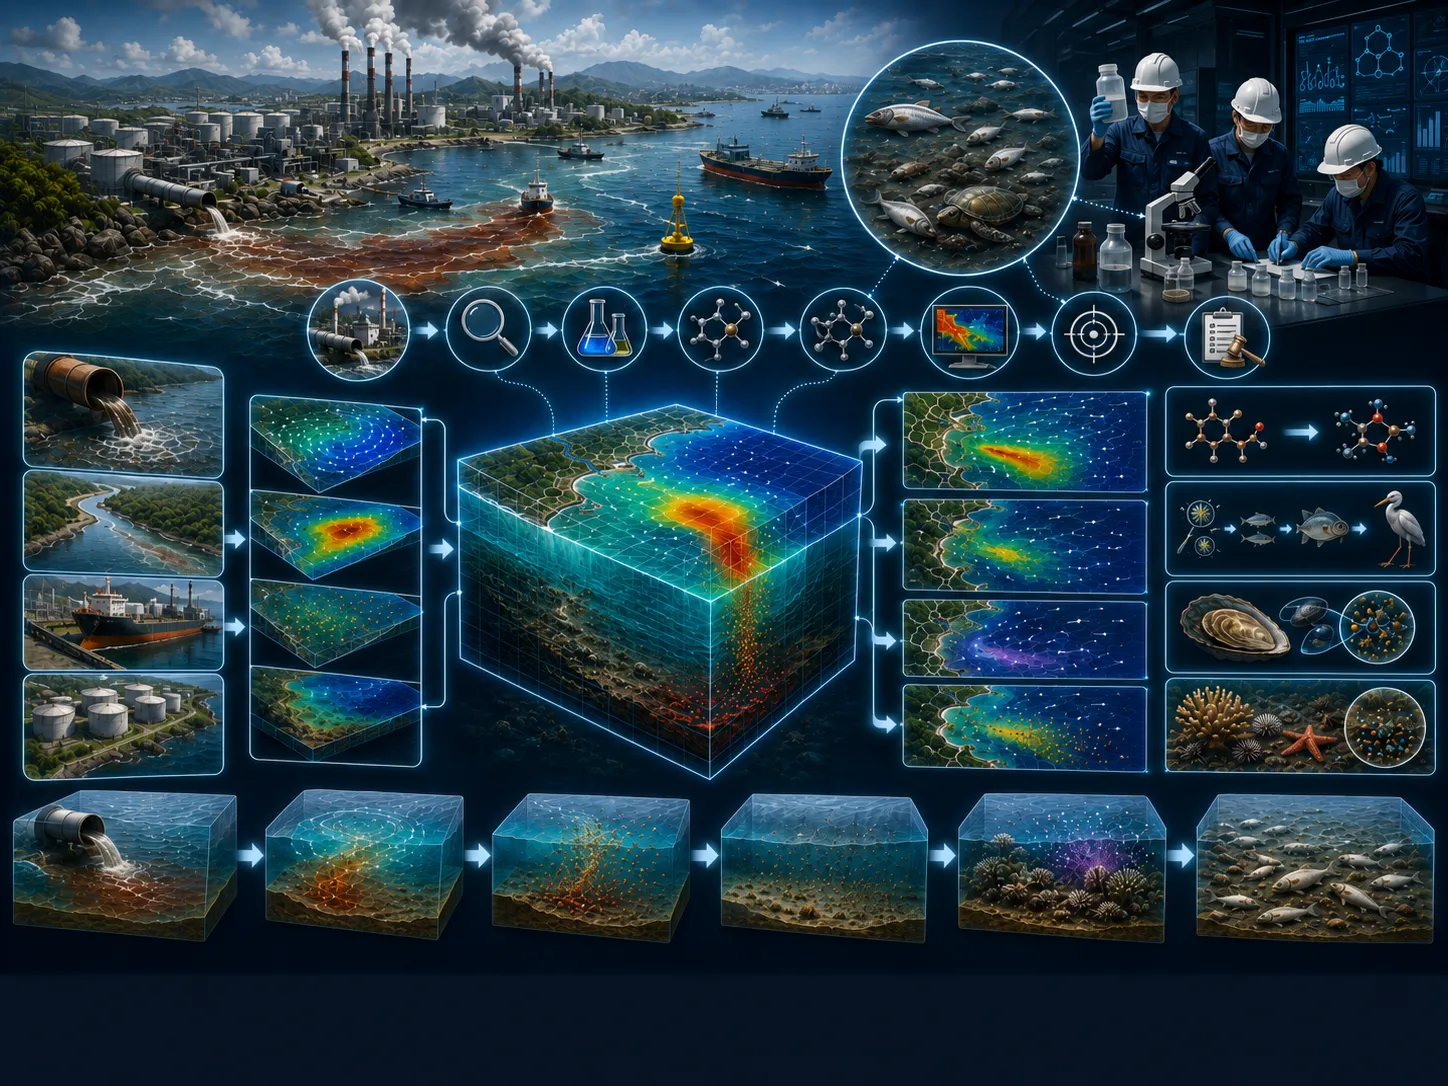
Modeling technology can support planning studies and assessments, response studies and assessments, as well as policy studies and assessments for coastal and marine management in the region.
Research on modeling may be conducted by various parties, including individuals and institutions from universities, government or private research institutions, NGO research organizations, and other…
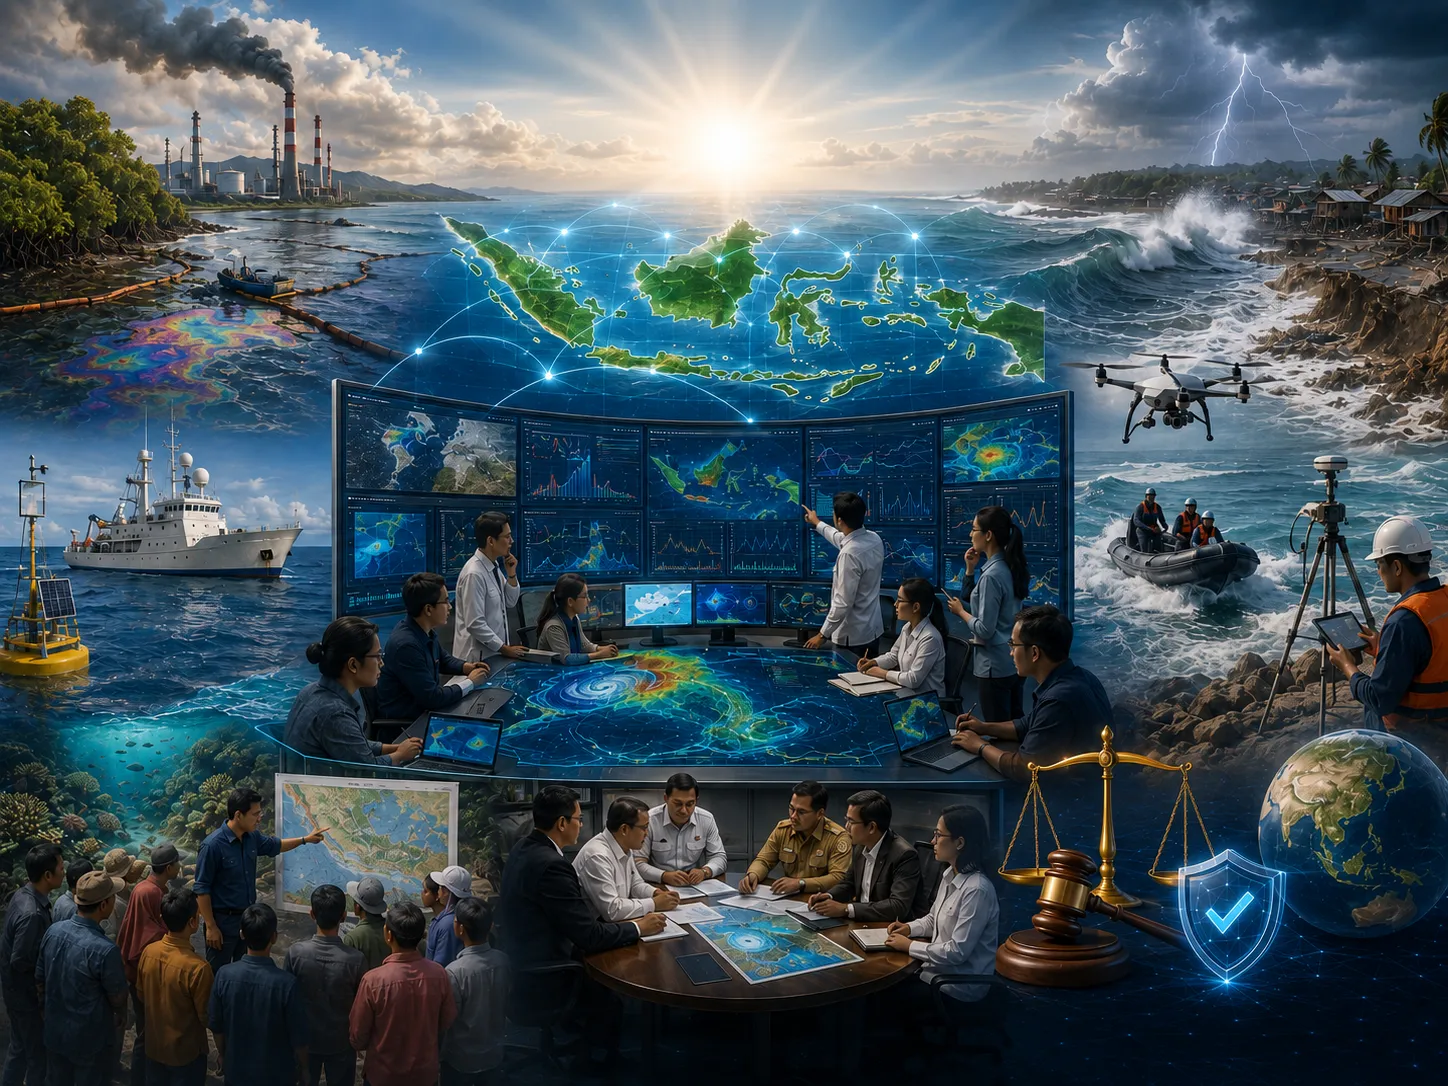
Learn more →Coastal and marine problems often occur in Indonesian waters. In some cases, these problems escalate and lead to prolonged public debate. Eventually, they may become national issues that must be addressed…
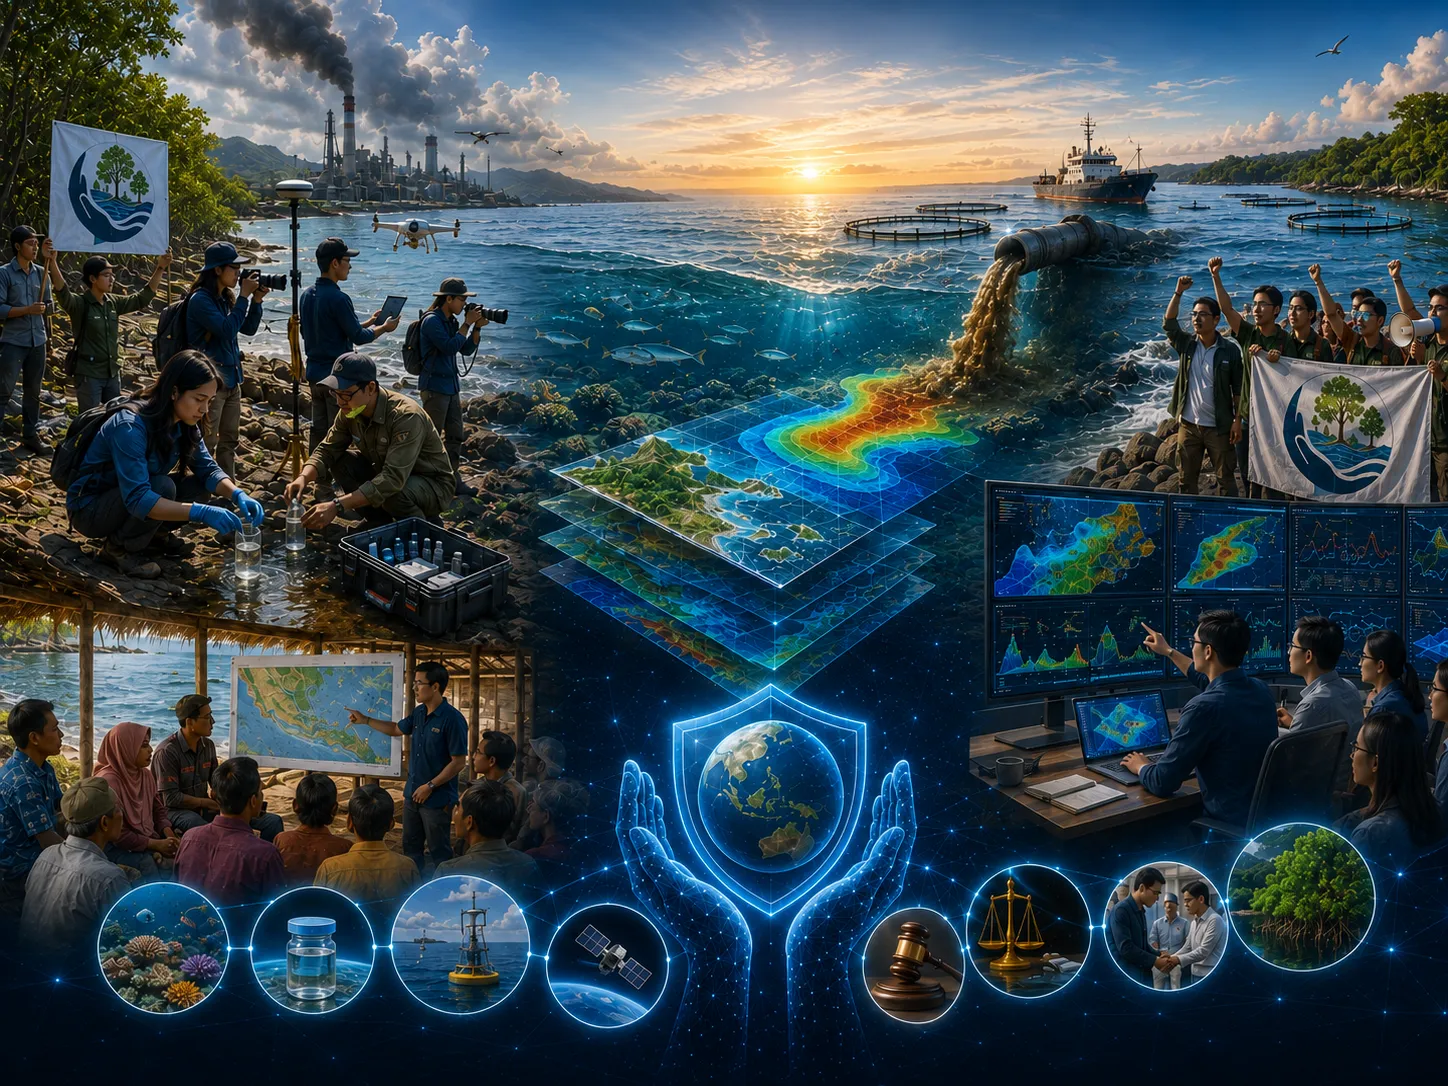
Learn more →Non-Governmental Organizations (NGOs) carry out activities that are closely connected to social and community interests in coastal areas.
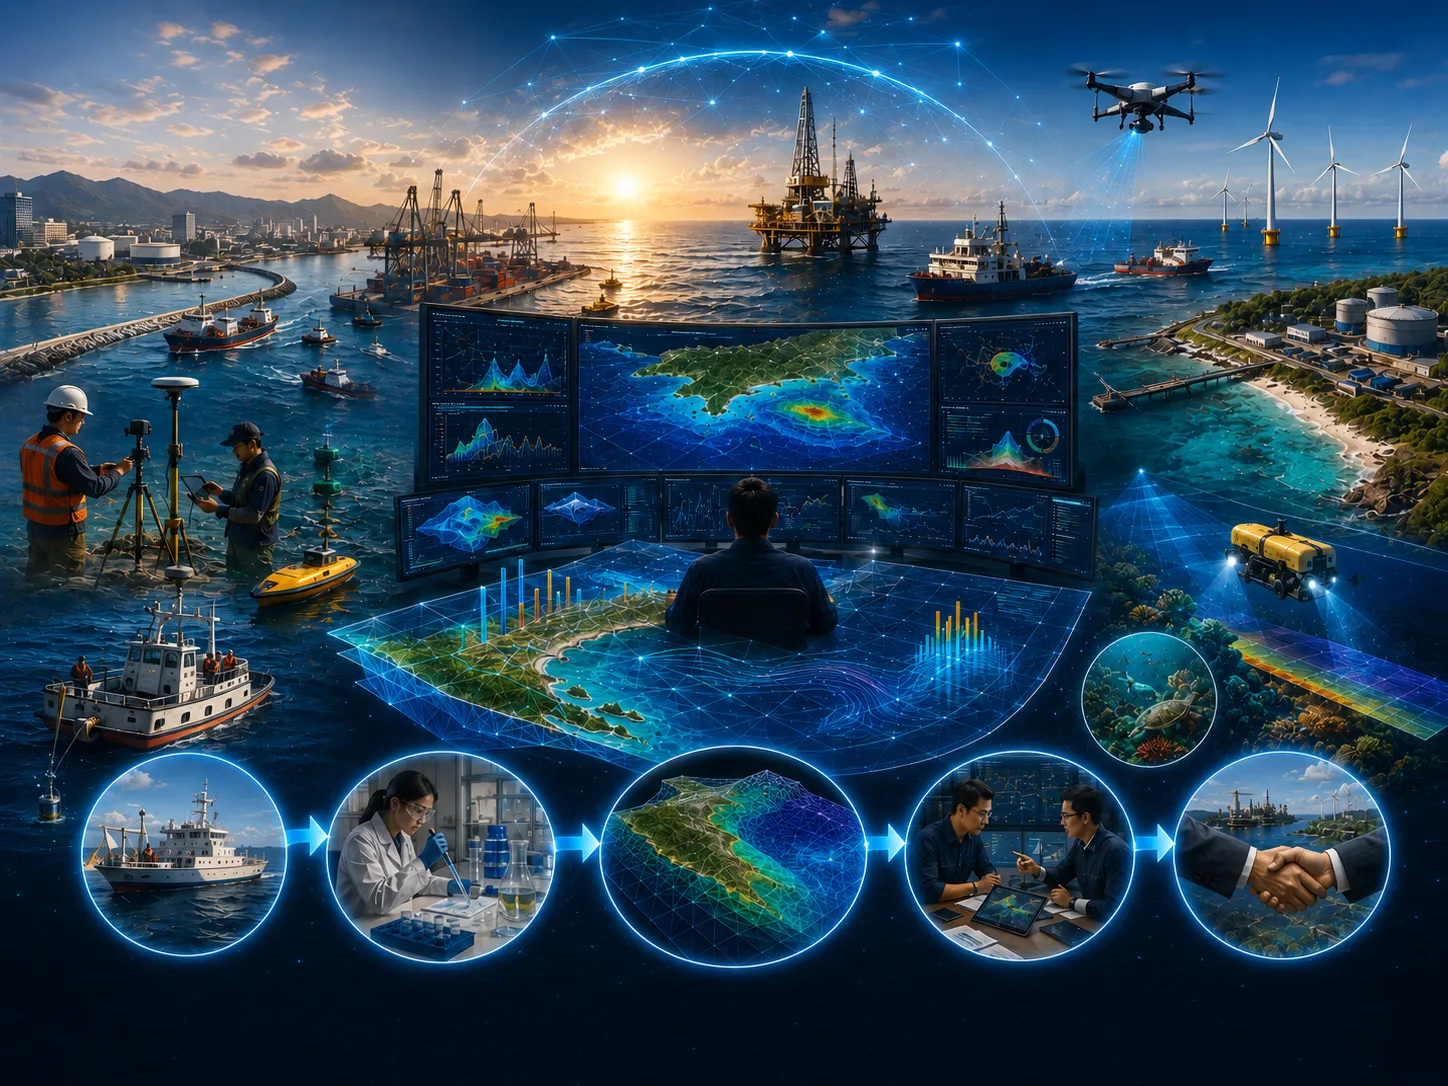
Learn more →The application of modeling technology can help improve performance and effectiveness in the planning, prevention, response, and operation of marine industries, from coastal areas to offshore waters.
Learn more →The CORZ team will review the objective, scope, data availability, risk level, schedule, and required outputs to prepare a proportionate approach.
Share the location, objectives, key challenges, available data, and expected outputs. The CORZ team will help define a proportionate technical approach.