CONTEXTField conditions and systems being assessed
Enter at least two characters.
Environmental conditions at marine aquaculture sites vary continuously over time, directly influencing the growth, health, and productivity of cultured species.
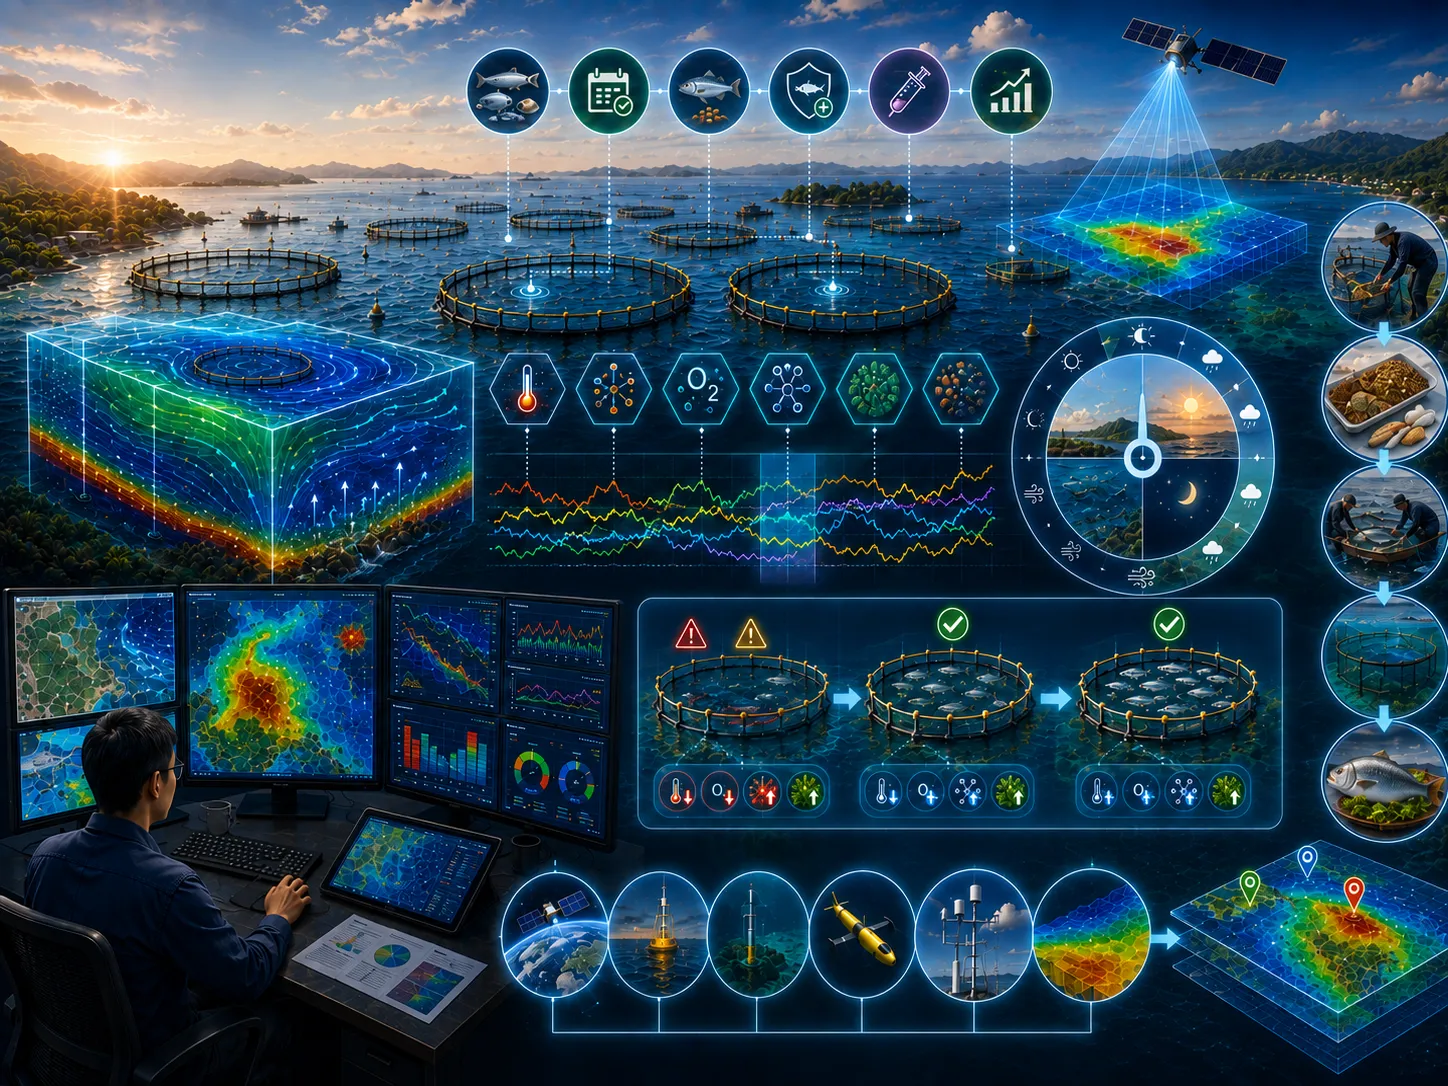
This page includes a one-page leaflet that can be opened in a full-image popup. It helps present the core CORZ service clearly and convincingly during project discussions, executive briefings, and decision-support meetings.
With a more proportional balance between visuals and text, the page feels brighter and more energetic while still keeping the important technical context visible and easy to understand.
Use this leaflet as a concise visual entry point before moving into the more detailed technical explanation.

Clarity before a decision is made
Environmental conditions at marine aquaculture sites vary continuously over time, directly influencing the growth, health, and productivity of cultured species.
Successful aquaculture management requires a thorough understanding of how cultured species respond to changes in their surrounding environment. Every species has unique physiological tolerances and responds differently to variations in water quality, hydrodynamics, and ecosystem conditions.
Define the approach, priorities, and actions for marine aquaculture management strategy using traceable evidence.
Environmental impact, design failure, operational disruption, uncontrolled cost, and weak assumptions.
Comparable options, quantified risk, and implementable recommendations.
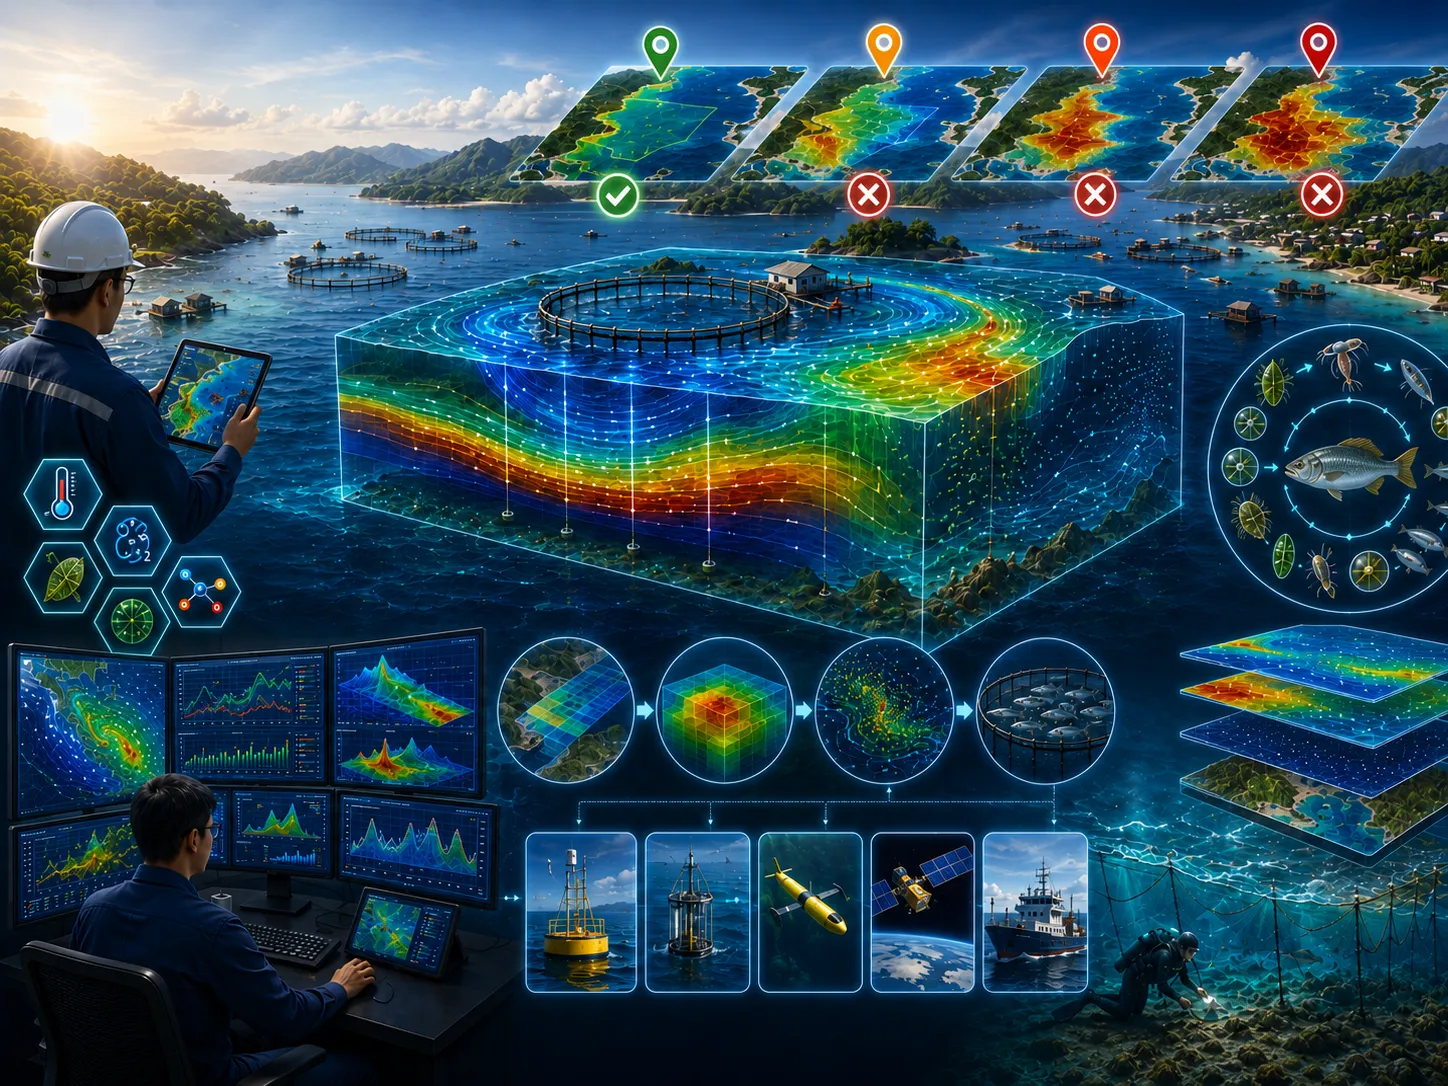
This aspect is assessed to clarify its implications for marine aquaculture management strategy.
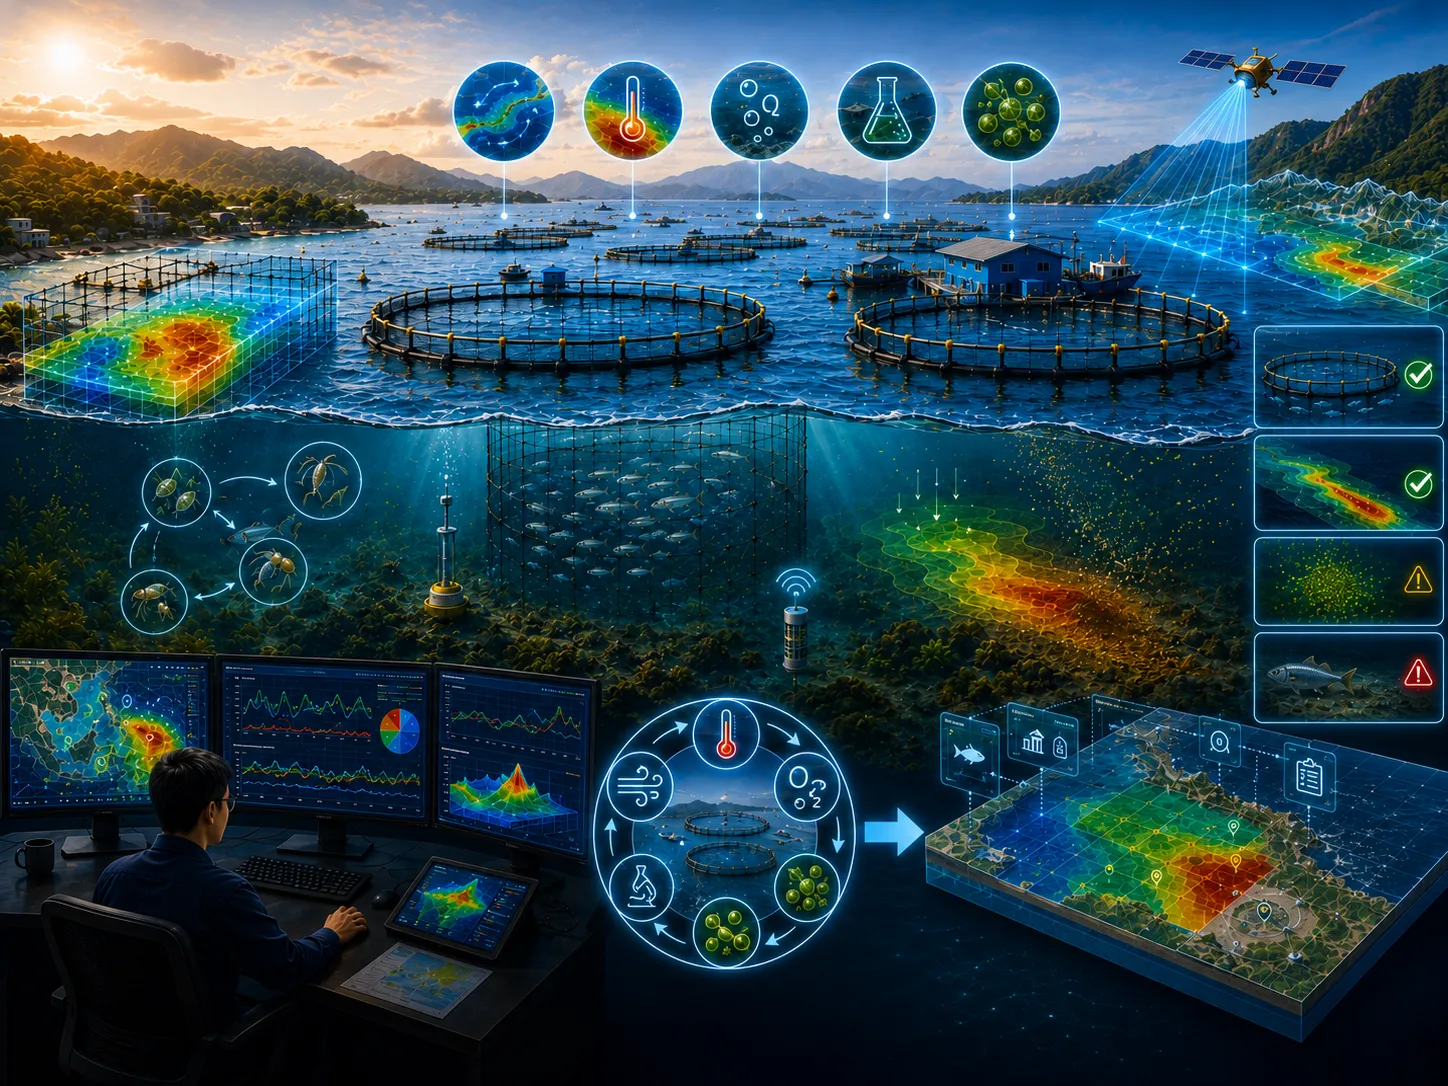
This aspect is assessed to clarify its implications for marine aquaculture management strategy.
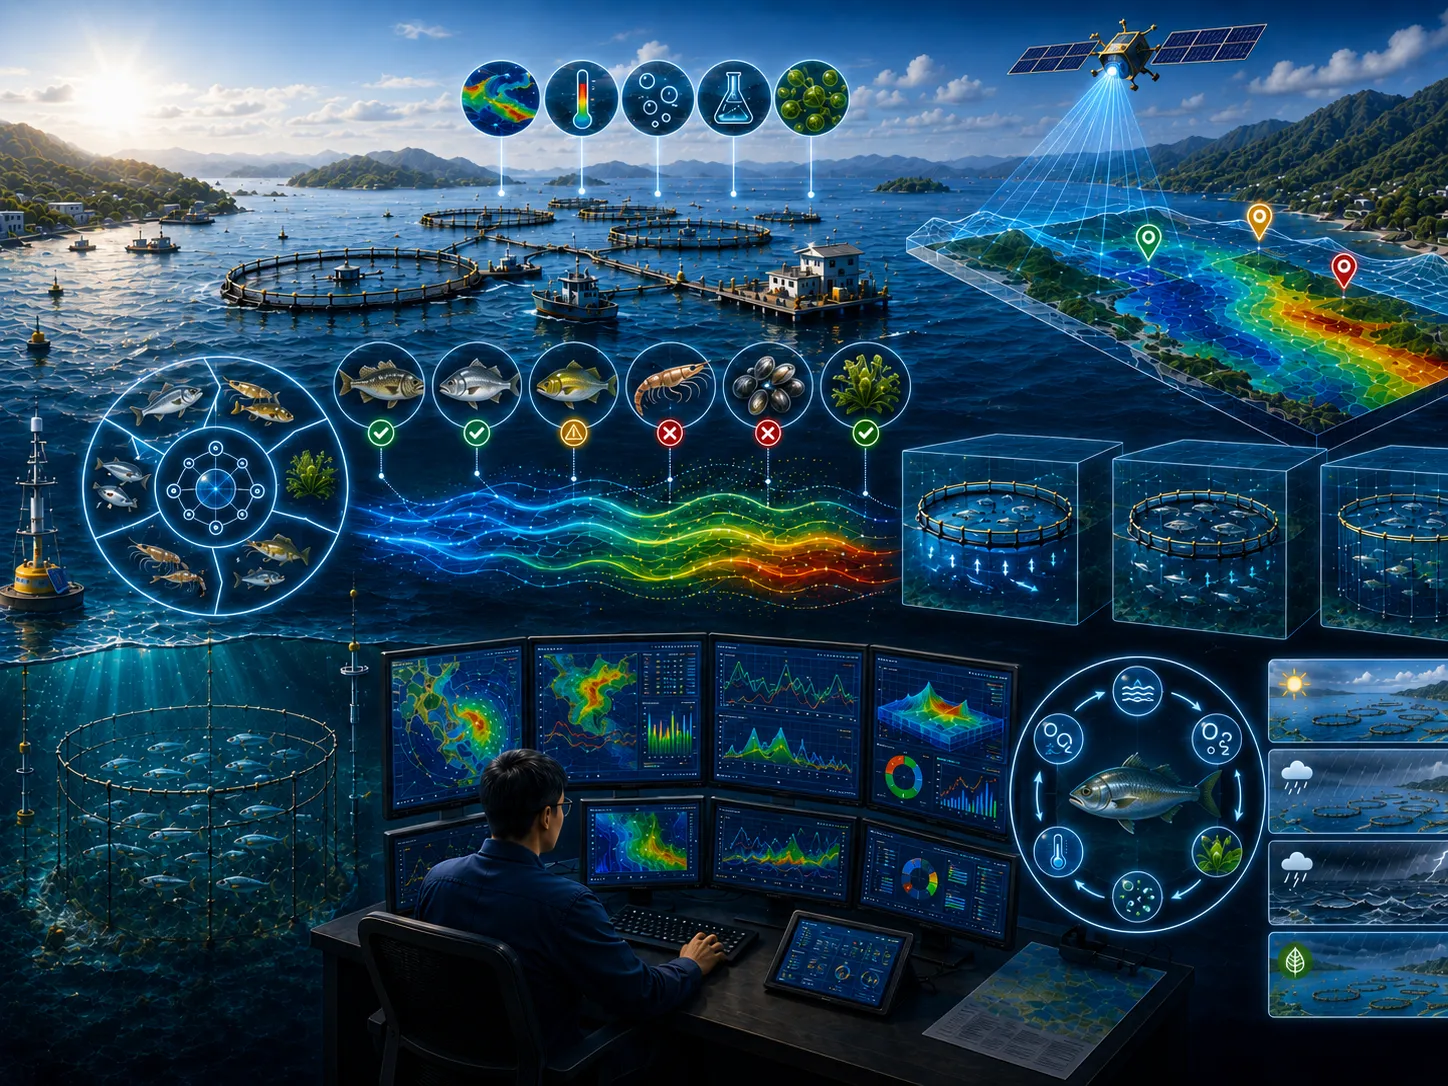
This aspect is assessed to clarify its implications for marine aquaculture management strategy.
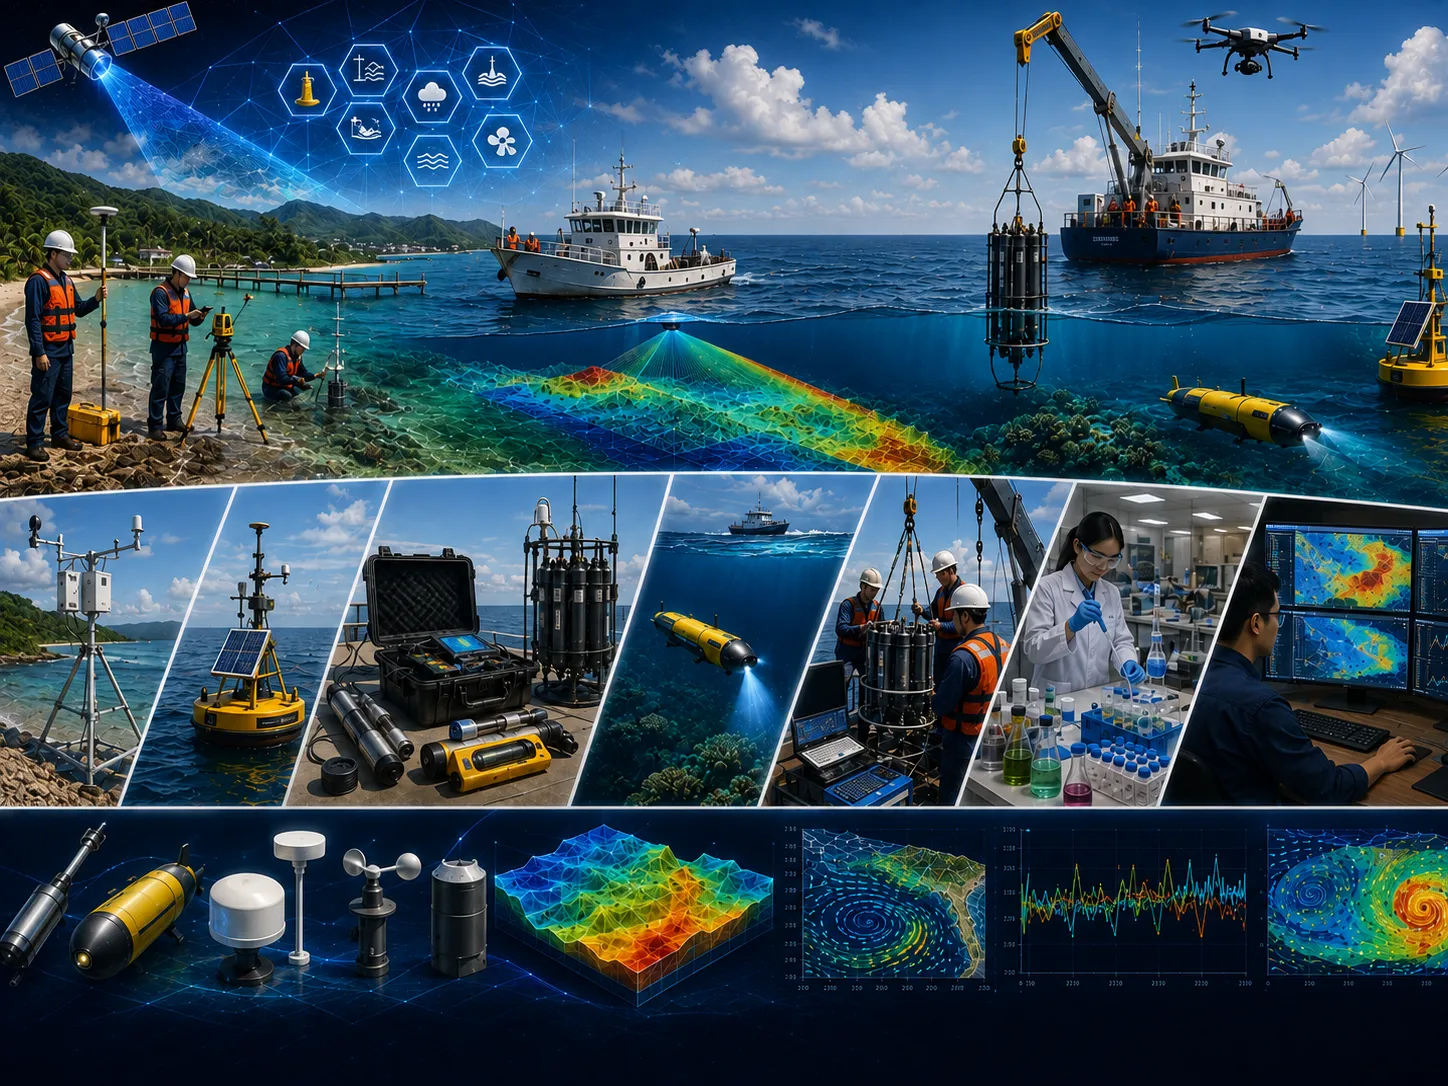
This aspect is assessed to clarify its implications for marine aquaculture management strategy.
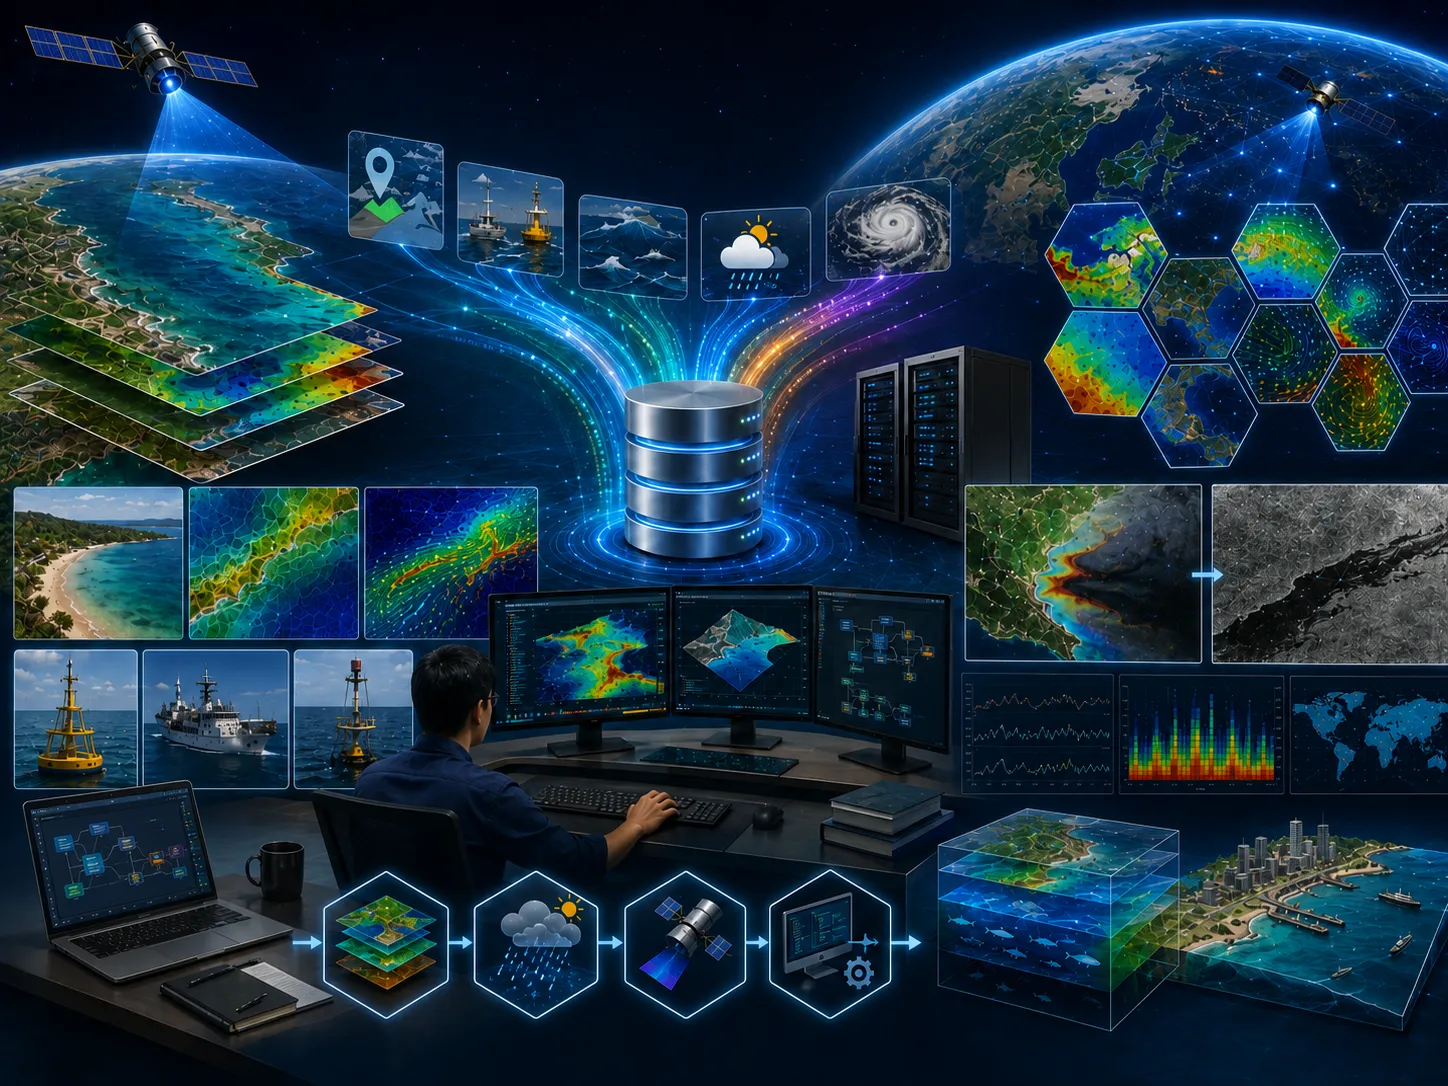
This aspect is assessed to clarify its implications for marine aquaculture management strategy.
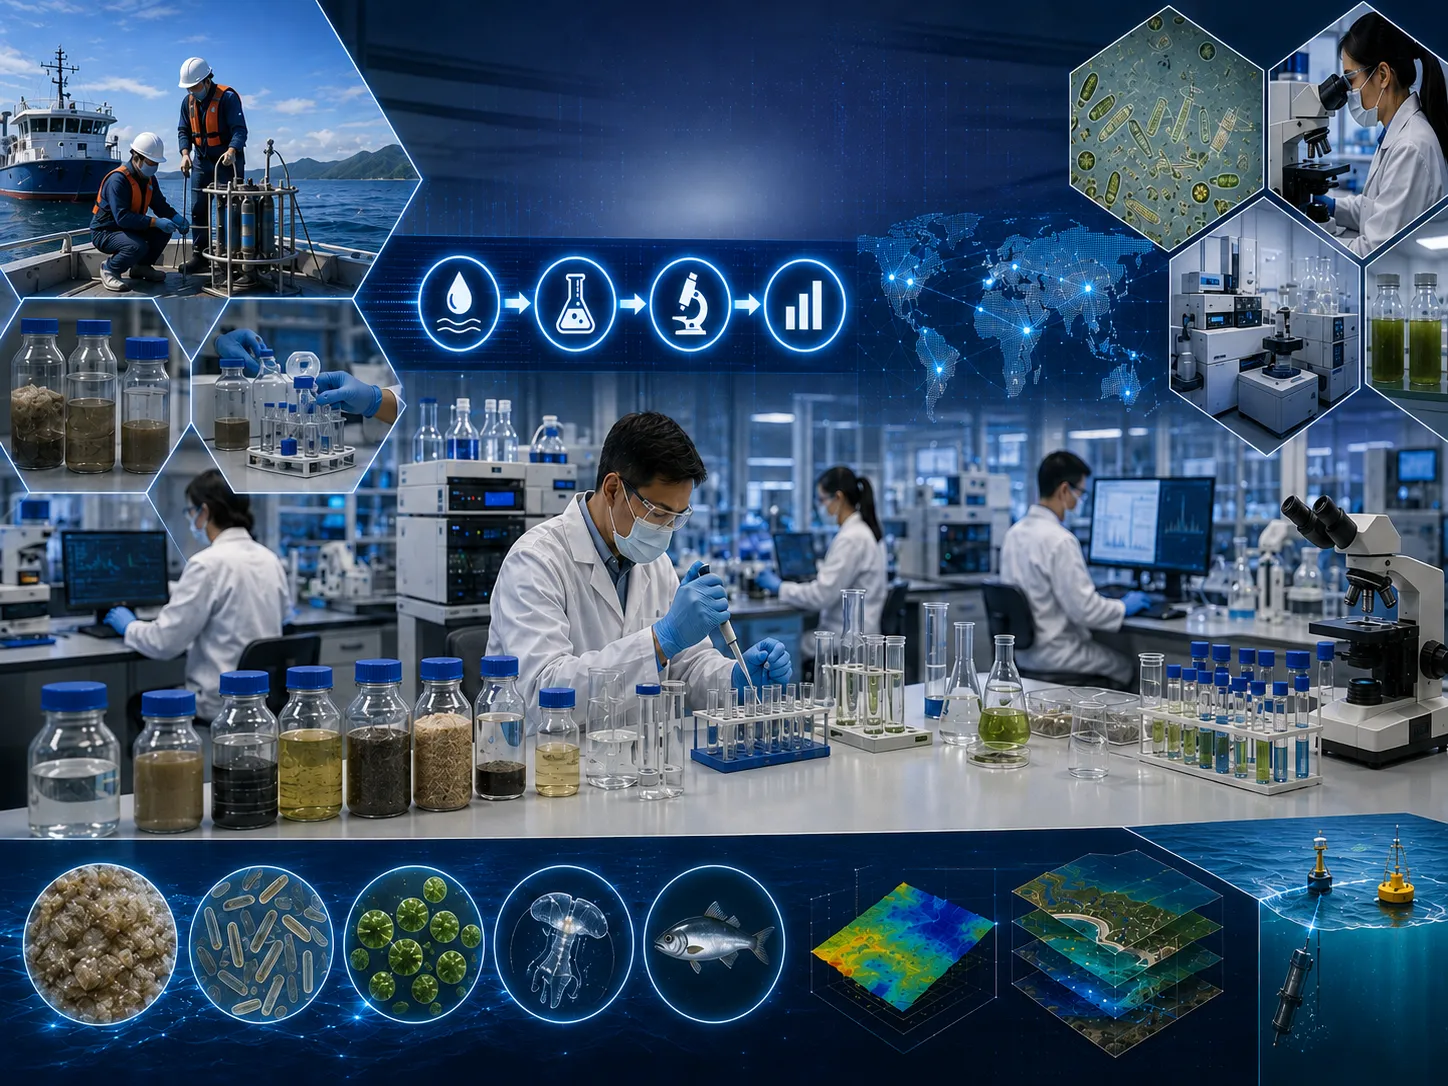
This aspect is assessed to clarify its implications for marine aquaculture management strategy.
Field surveys, in-situ measurements, laboratory results, historical records, and operating information as required.

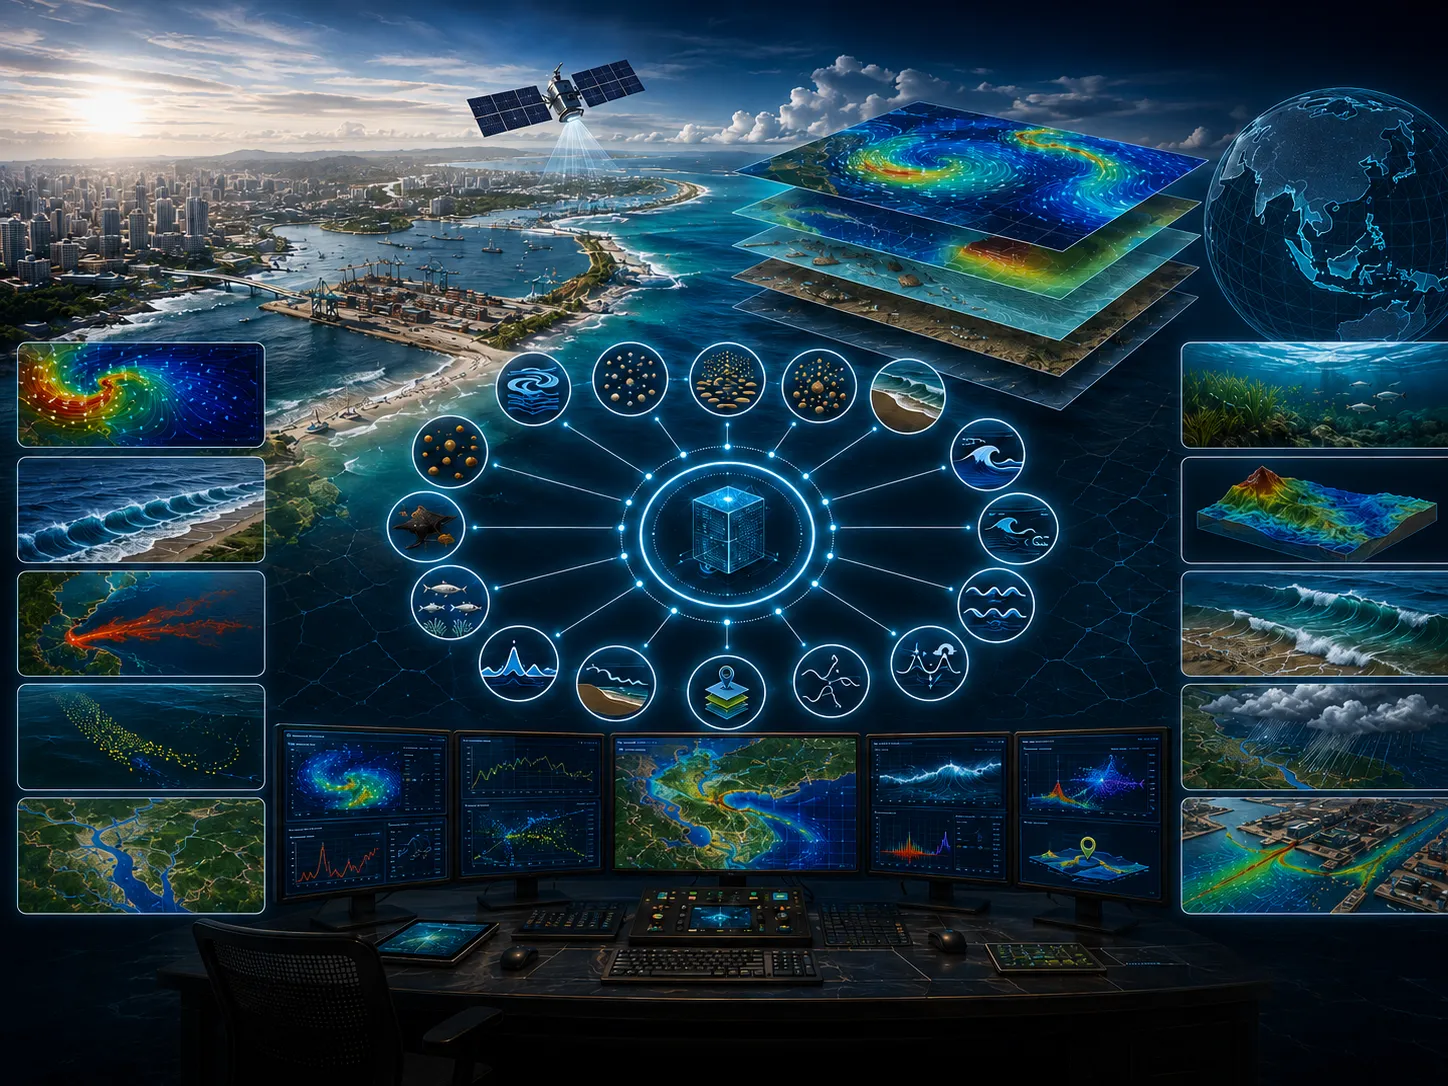
Satellite imagery, mapping, spatial analysis, temporal change, and integration of multiple data sources.
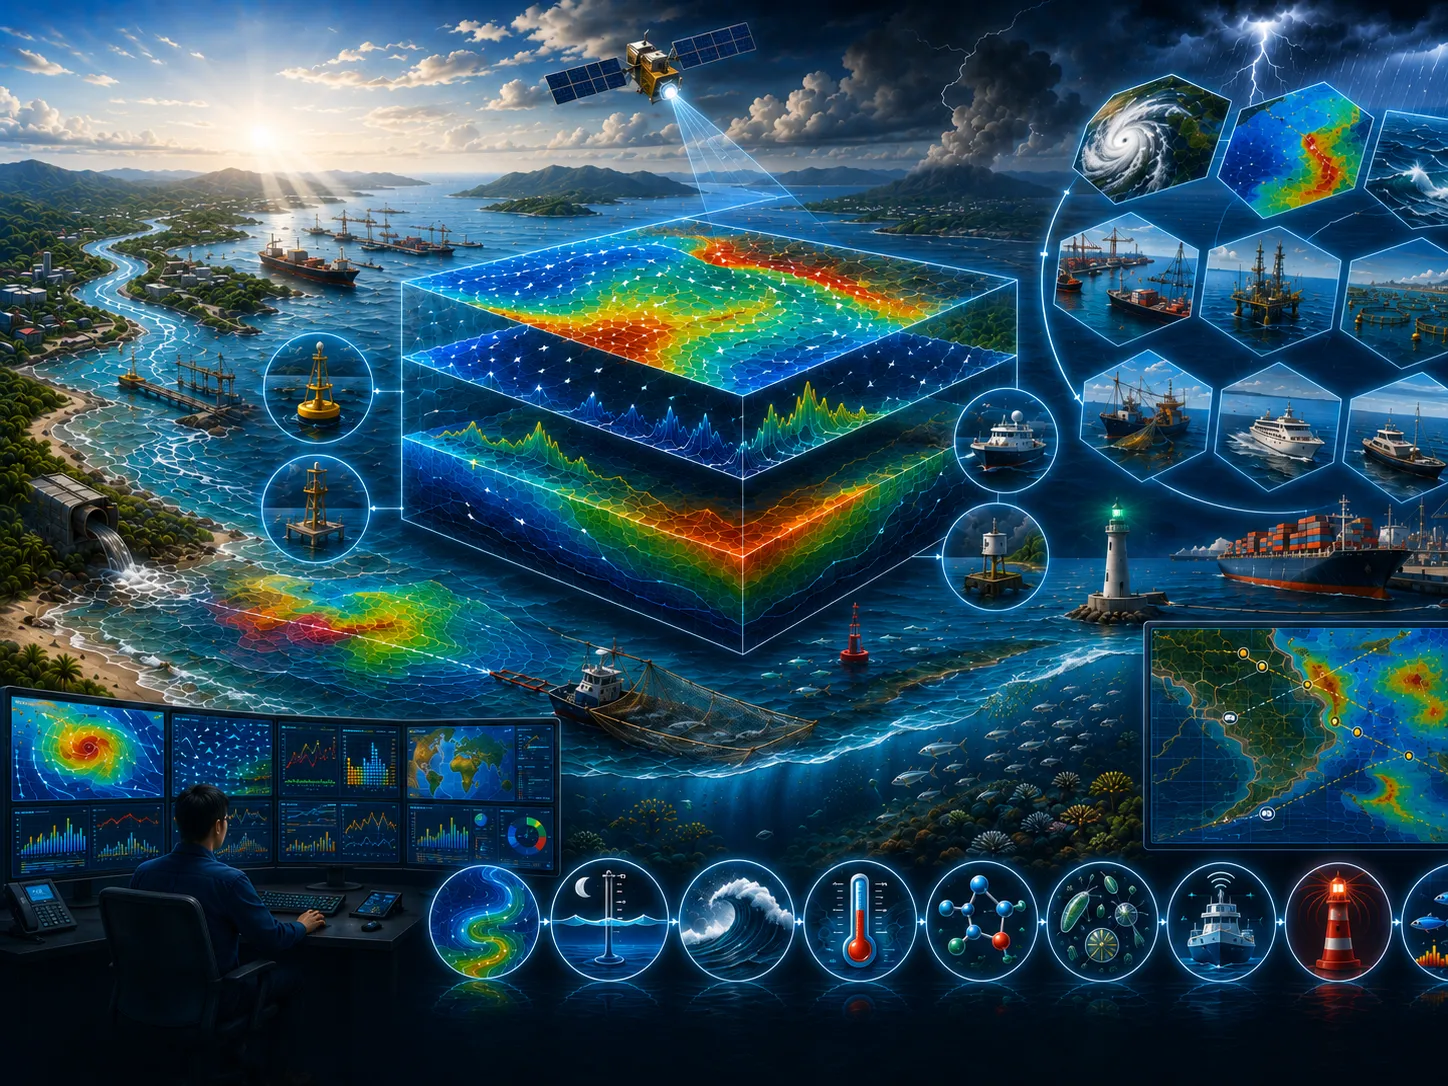
Model setup, calibration, validation, existing–planned–extreme scenarios, and sensitivity analysis.
Metadata, quality controls, assumptions, limitations, data versions, and processing lineage are documented.
Objectives, study area, available data, additional needs, initial risks, and recommended level of detail.
Quality-controlled data, thematic maps, time series, indicators, and comparable visualizations.
Comparison of existing conditions, alternatives, extremes, sensitivities, consequences, and mitigation options.
Methods, results, limitations, recommendations, action priorities, and stakeholder presentation materials.
Assumptions, data, variability, and limitations are stated so decision risk is not hidden.
Alternative locations, designs, operations, or policies are assessed using consistent indicators.
Data needs and analysis depth are proportionate to risk so resources are used efficiently.
Findings and recommendations are transparent for technical, management, regulatory, and partner review.
Objectives, users, location, project phase, problems, constraints, and the decision to support.
Methods, data, surveys, models, schedule, team, deliverables, review gates, and resource estimate.
Collection, inspection, harmonization, documentation, and data-sufficiency assessment.
Processing, modeling, validation, option comparison, sensitivity, and risk evaluation.
Maps, report, executive brief, presentation, supporting data, and follow-up plan.
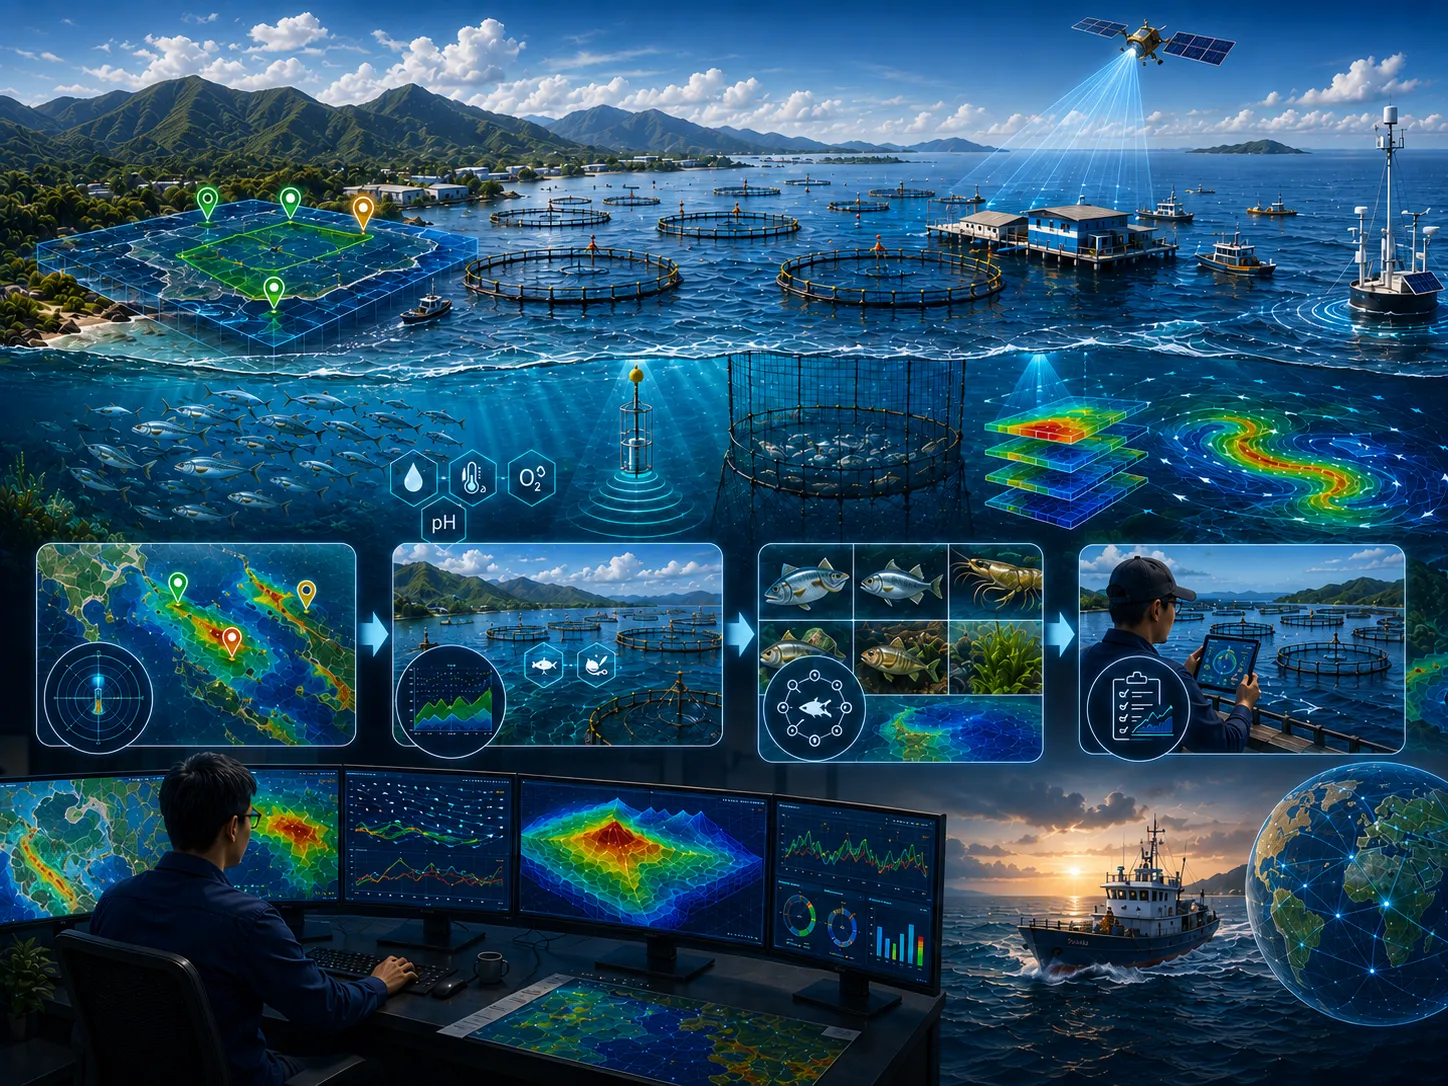
Environmental conditions at marine aquaculture sites vary continuously over time, directly influencing the growth, health, and productivity of cultured species. During certain periods, environmental conditions promote rapid growth, while at other times they may reduce growth rates or increase stress. Consequently, management practices that are effective under one set of environmental conditions may become ineffective—or even harmful—under another. Every aquaculture operation should therefore be scheduled according to periods when environmental conditions are most favorable. Examples include determining the optimal time for stocking juvenile fish, scheduling daily feeding to maximize feed utilization, and anticipating disease outbreaks based on changing environmental conditions so that preventive actions can be implemented before production is affected.
Successful aquaculture management requires a thorough understanding of how cultured species respond to changes in their surrounding environment. Every species has unique physiological tolerances and responds differently to variations in water quality, hydrodynamics, and ecosystem conditions. By understanding these relationships, aquaculture operators can develop management strategies that optimize fish growth, reduce environmental risks, improve operational efficiency, and maximize long-term profitability.
Numerical modeling provides an effective scientific framework for developing evidence-based aquaculture management strategies. Modeling enables managers to understand how physical, chemical, and biological processes evolve over time and how these processes influence cultured species. This knowledge supports faster and more accurate decision-making while reducing uncertainty in aquaculture operations.
Modeling scenarios are developed based on site-specific environmental conditions, seasonal and annual variability, extreme environmental events, and operational management schedules. These simulations identify recurring environmental cycles, evaluate potential risks associated with extreme conditions, and determine the most effective timing for aquaculture activities. Simulation results are then analyzed together with the biological characteristics of the cultured species to develop practical management strategies that improve productivity while minimizing operational risks.
Naturally, each fish species occupies a habitat that best meets its biological and ecological requirements.
Learn more →In coastal spatial planning, designated marine areas are often allocated for aquaculture development, or large-scale aquaculture projects are proposed by the fisheries industry.
Learn more →Every aquatic environment has unique characteristics that distinguish it from other water bodies.
Learn more →The CORZ team will review the objective, scope, data availability, risk level, schedule, and required outputs to prepare a proportionate approach.
Share the location, objectives, key challenges, available data, and expected outputs. The CORZ team will help define a proportionate technical approach.