
CONTEXTField conditions and systems being assessed
Enter at least two characters.
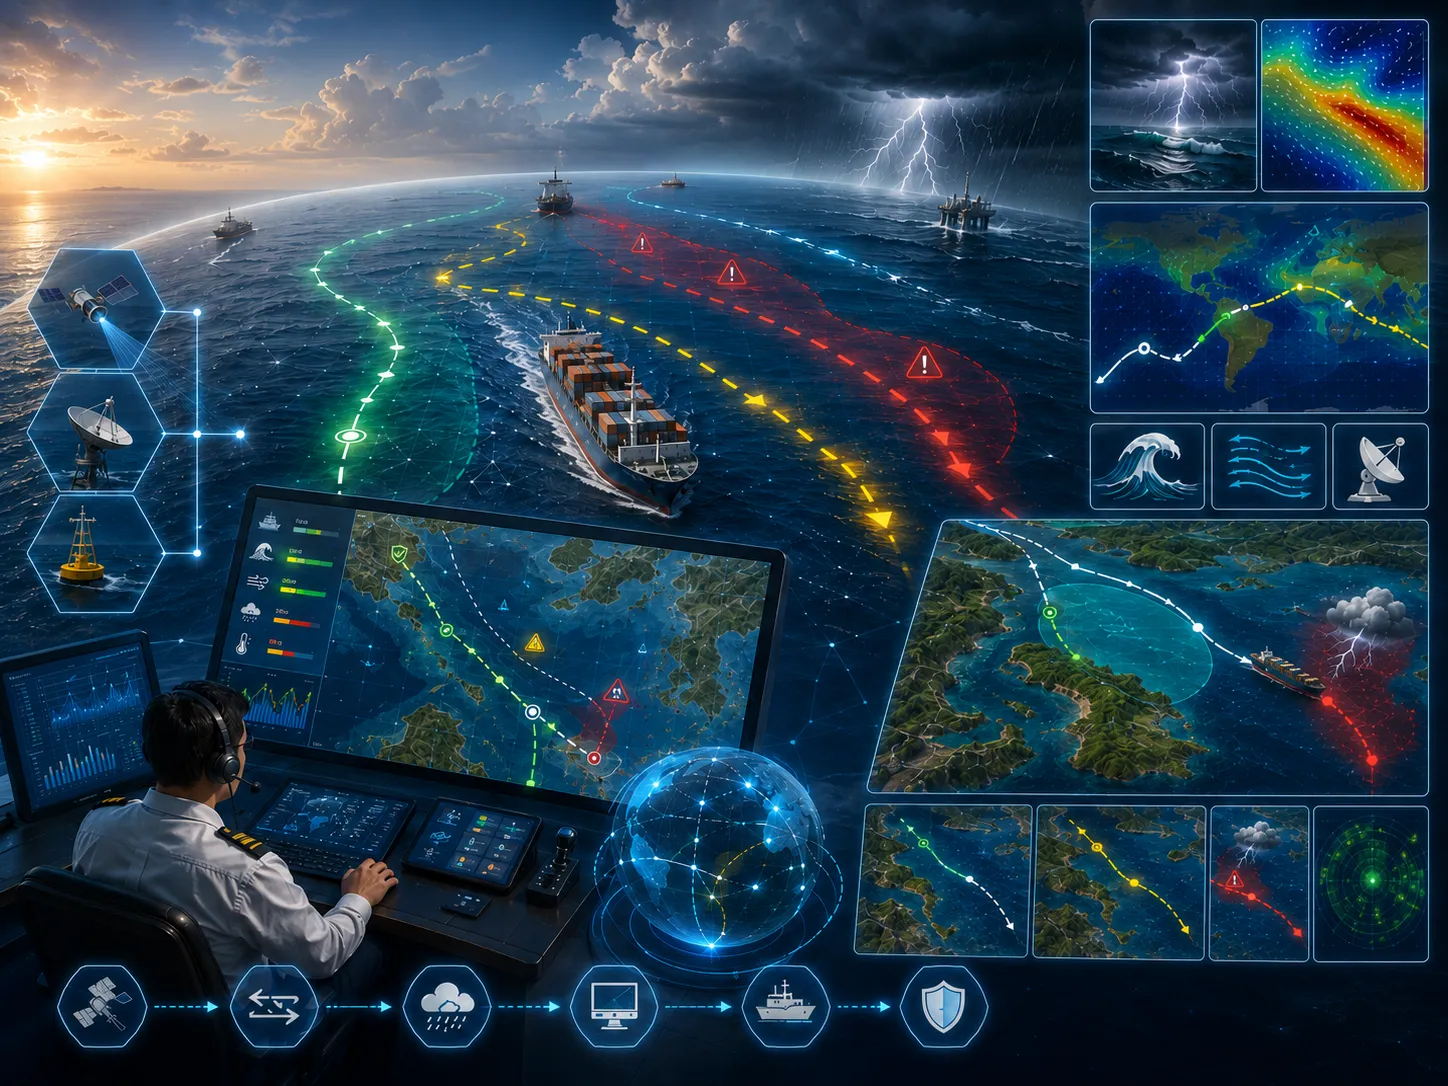
Determining the most suitable shipping route is a critical component of safe and efficient maritime operations.
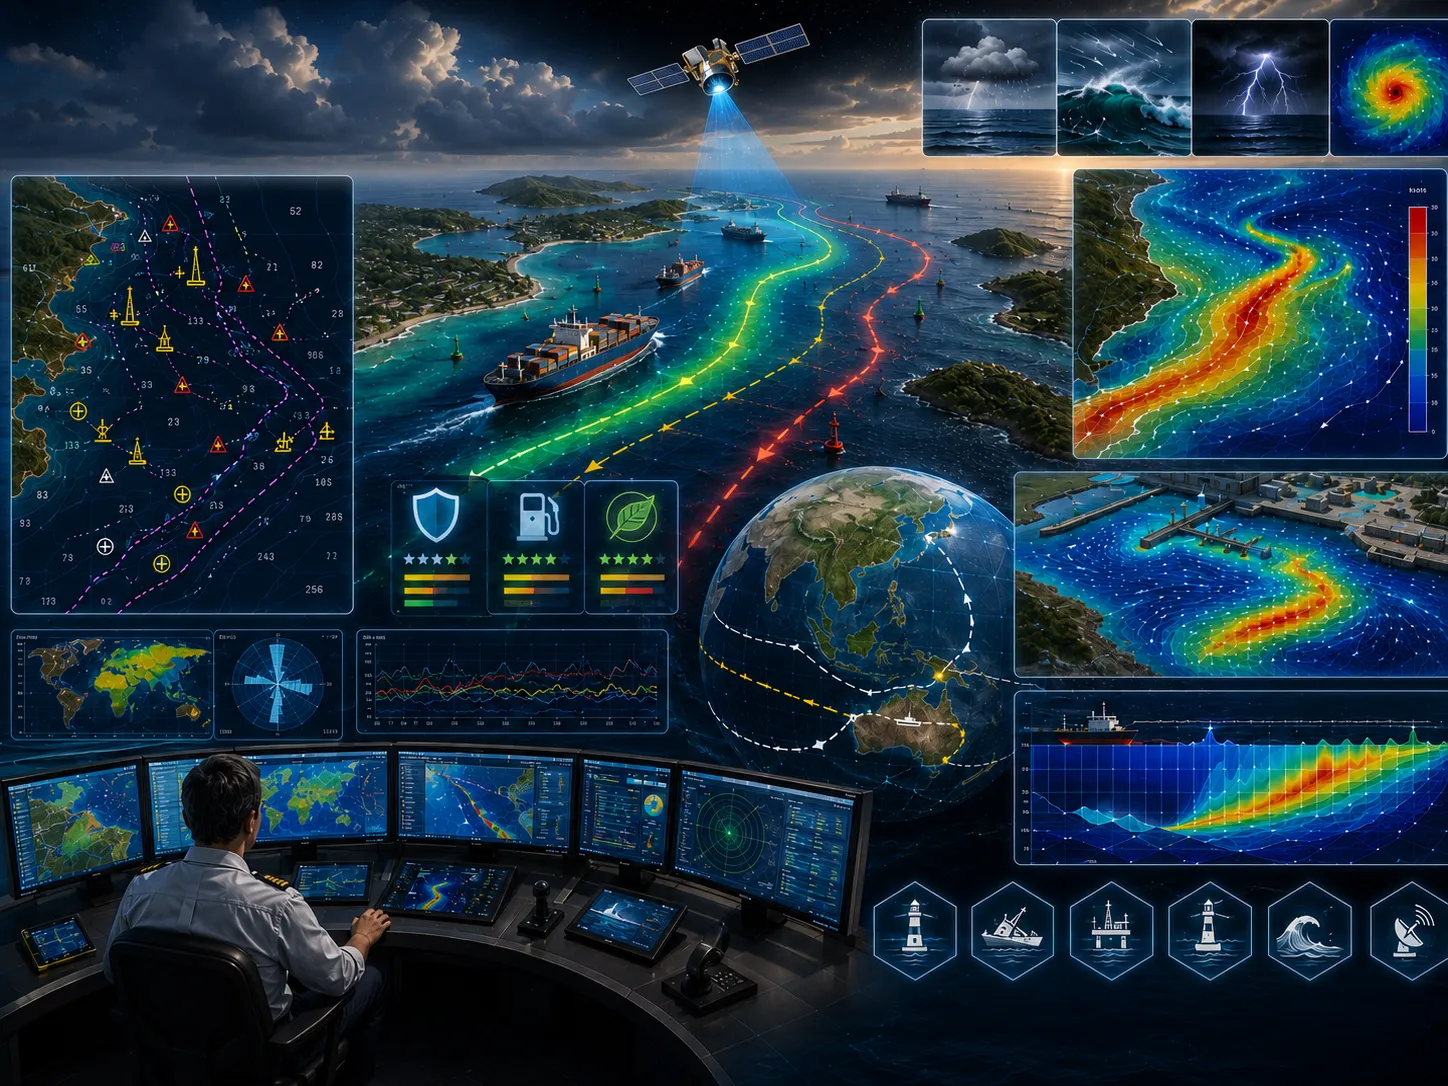
This page includes a one-page leaflet that can be opened in a full-image popup. It helps present the core CORZ service clearly and convincingly during project discussions, executive briefings, and decision-support meetings.
With a more proportional balance between visuals and text, the page feels brighter and more energetic while still keeping the important technical context visible and easy to understand.
Use this leaflet as a concise visual entry point before moving into the more detailed technical explanation.

Clarity before a decision is made
Determining the most suitable shipping route is a critical component of safe and efficient maritime operations.
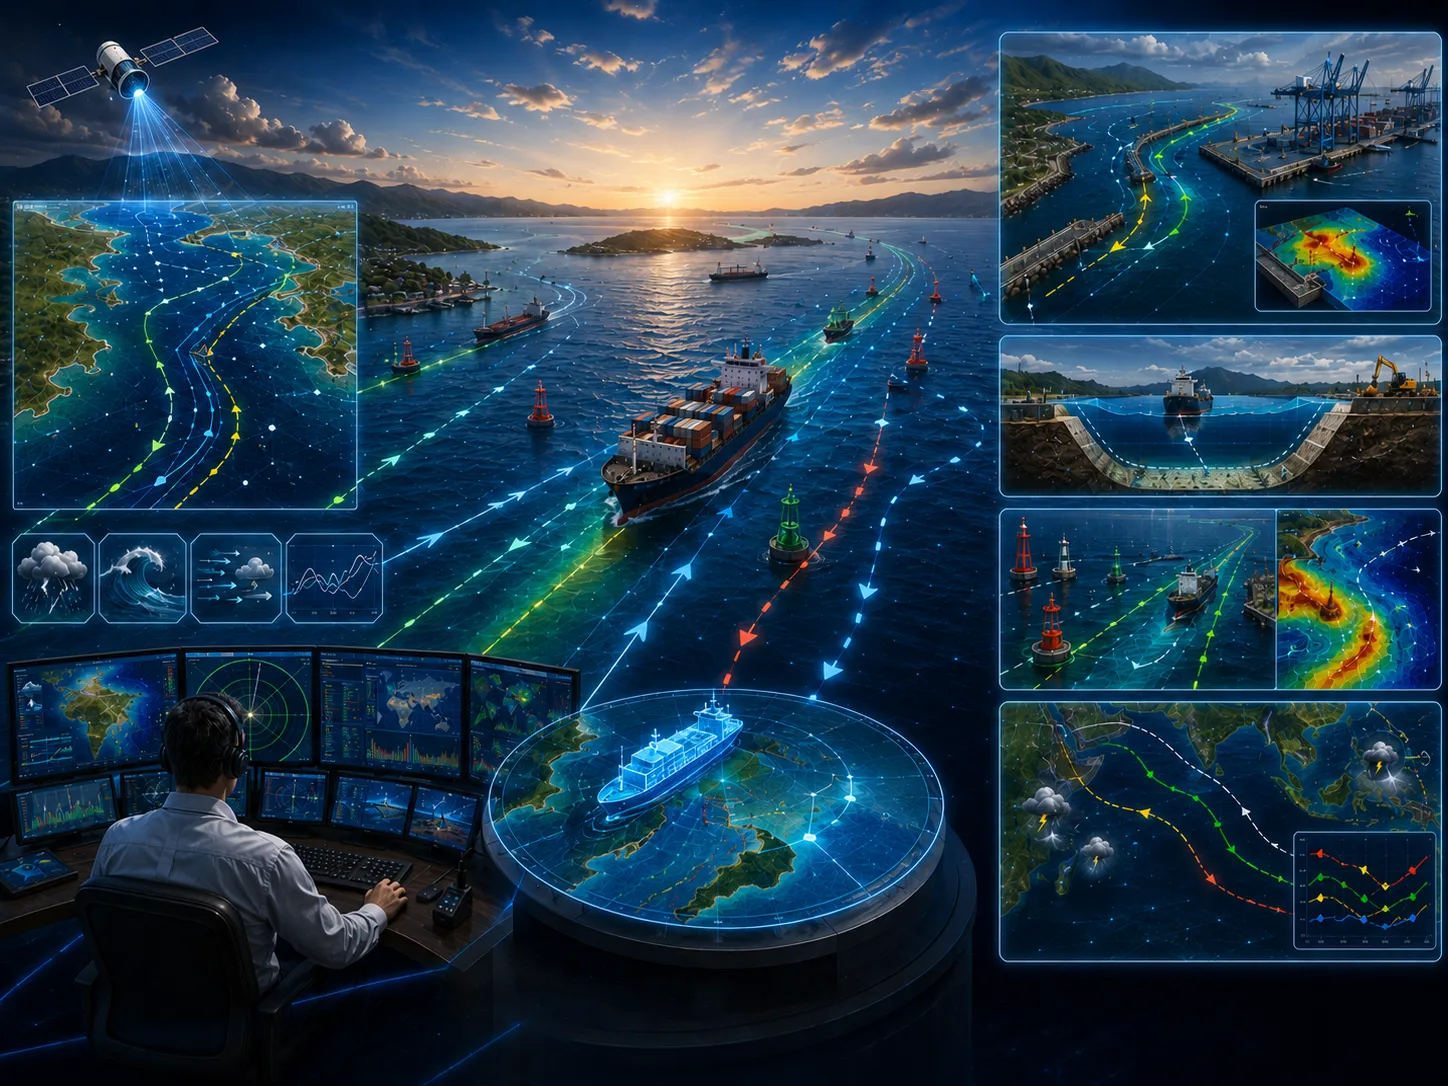
Modern navigation charts already provide essential information such as bathymetry, wreck locations, offshore structures, and, in some digital navigation systems, forecasts of weather and tides. However, these capabilities are often insufficient because actual ocean conditions may differ significantly from forecast conditions while a vessel is already underway.
Define the approach, priorities, and actions for shipping route determination using traceable evidence.
Environmental impact, design failure, operational disruption, uncontrolled cost, and weak assumptions.
Comparable options, quantified risk, and implementable recommendations.
This aspect is assessed to clarify its implications for shipping route determination.
This aspect is assessed to clarify its implications for shipping route determination.
This aspect is assessed to clarify its implications for shipping route determination.

This aspect is assessed to clarify its implications for shipping route determination.

This aspect is assessed to clarify its implications for shipping route determination.
This aspect is assessed to clarify its implications for shipping route determination.

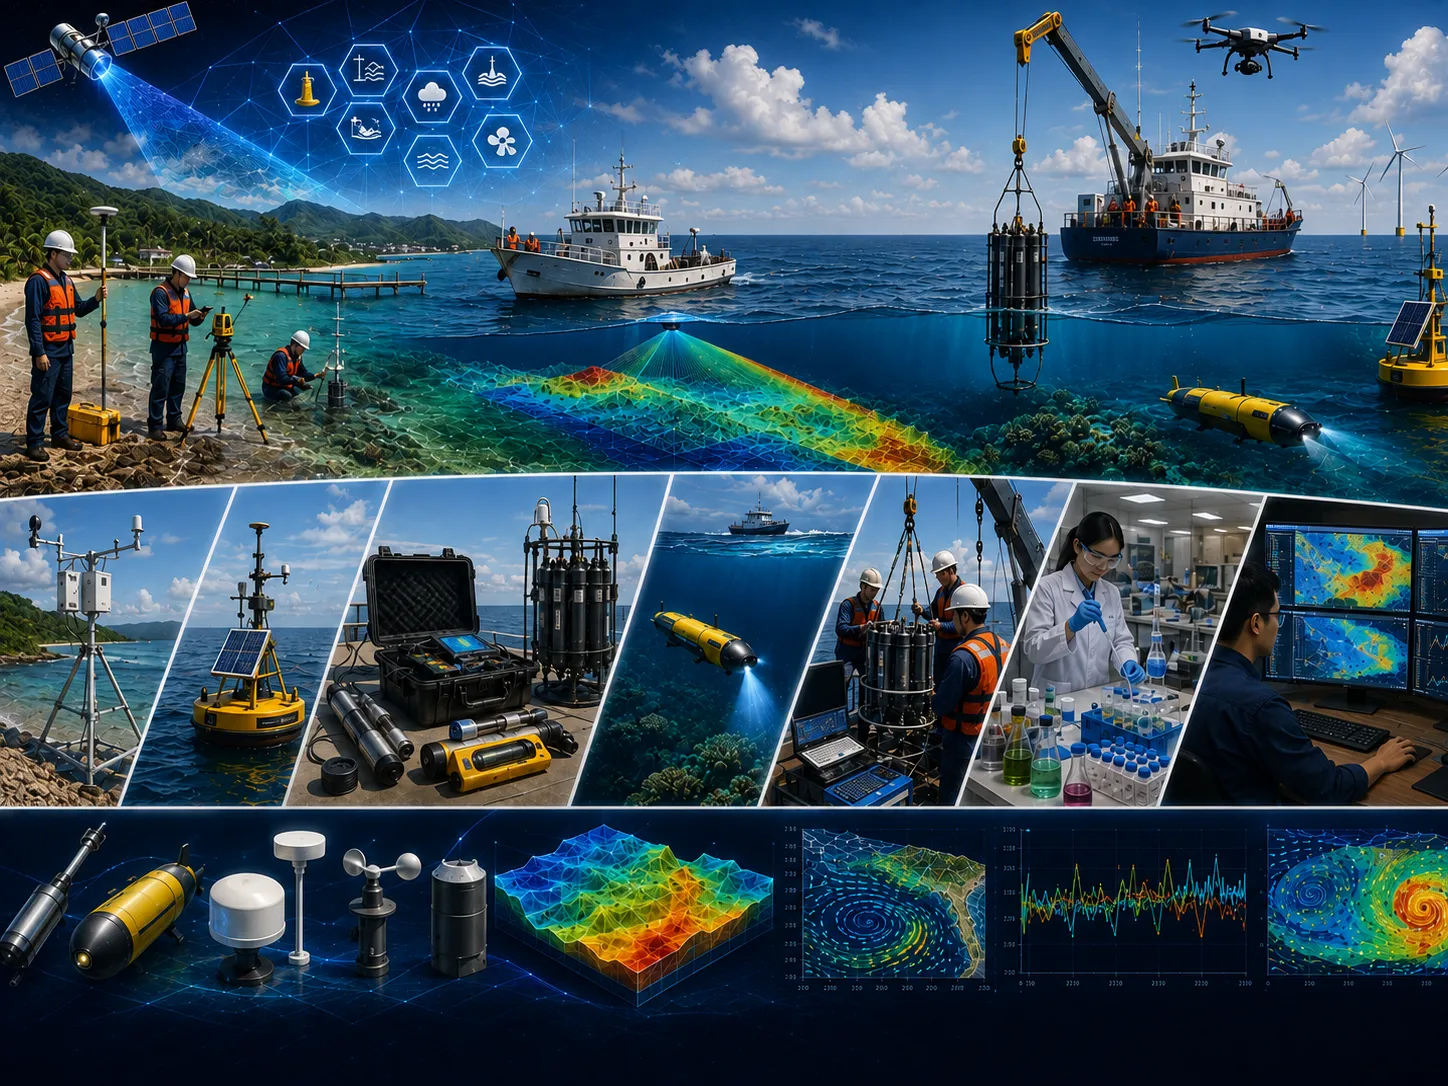
Field surveys, in-situ measurements, laboratory results, historical records, and operating information as required.
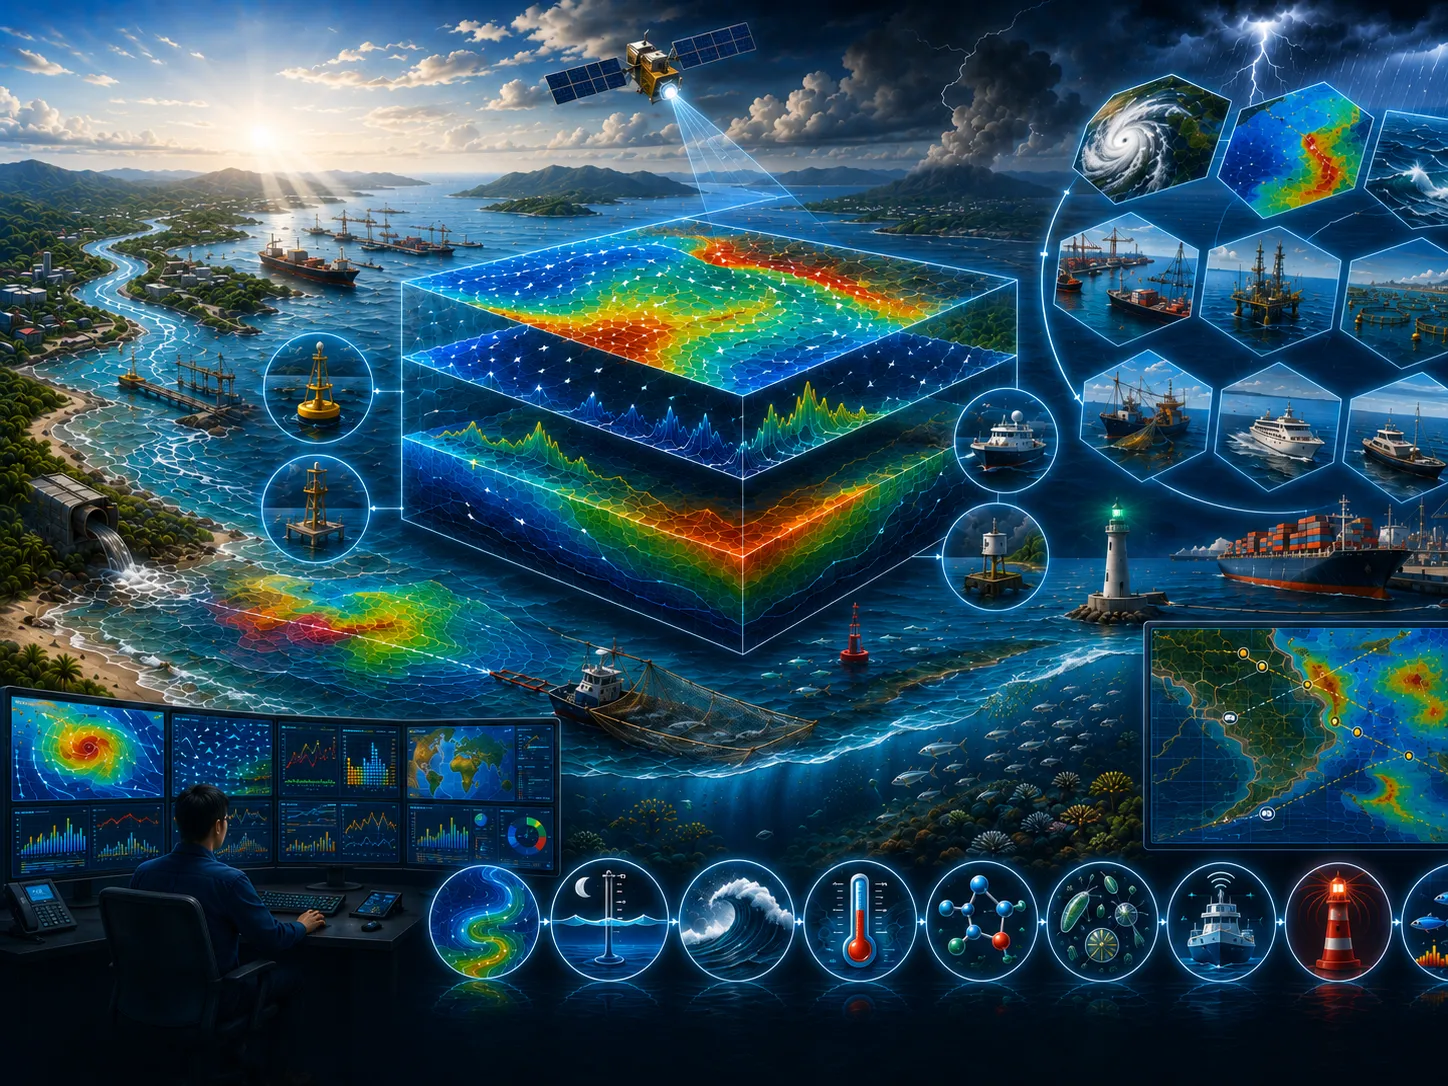
Satellite imagery, mapping, spatial analysis, temporal change, and integration of multiple data sources.
Model setup, calibration, validation, existing–planned–extreme scenarios, and sensitivity analysis.
Metadata, quality controls, assumptions, limitations, data versions, and processing lineage are documented.
Objectives, study area, available data, additional needs, initial risks, and recommended level of detail.
Quality-controlled data, thematic maps, time series, indicators, and comparable visualizations.
Comparison of existing conditions, alternatives, extremes, sensitivities, consequences, and mitigation options.
Methods, results, limitations, recommendations, action priorities, and stakeholder presentation materials.
Assumptions, data, variability, and limitations are stated so decision risk is not hidden.
Alternative locations, designs, operations, or policies are assessed using consistent indicators.
Data needs and analysis depth are proportionate to risk so resources are used efficiently.
Findings and recommendations are transparent for technical, management, regulatory, and partner review.
Objectives, users, location, project phase, problems, constraints, and the decision to support.
Methods, data, surveys, models, schedule, team, deliverables, review gates, and resource estimate.
Collection, inspection, harmonization, documentation, and data-sufficiency assessment.
Processing, modeling, validation, option comparison, sensitivity, and risk evaluation.
Maps, report, executive brief, presentation, supporting data, and follow-up plan.
Determining the most suitable shipping route is a critical component of safe and efficient maritime operations. Whether a vessel is traveling across open waters, approaching a port, or entering an anchorage area, route planning requires careful evaluation of numerous environmental and operational factors. The primary objectives are ship safety and operational efficiency. Ship safety focuses on minimizing risks associated with waves, adverse weather, and other hazardous sea conditions, while operational efficiency aims to reduce resistance caused by waves, ocean currents, and wind, thereby lowering fuel consumption and other voyage-related operating costs. Because oceanographic and climatic conditions generally follow predictable monthly and seasonal patterns, integrating these conditions with digital navigation charts enables voyage planners to determine the safest and most fuel-efficient route before departure.
Modern navigation charts already provide essential information such as bathymetry, wreck locations, offshore structures, and, in some digital navigation systems, forecasts of weather and tides. However, these capabilities are often insufficient because actual ocean conditions may differ significantly from forecast conditions while a vessel is already underway. Furthermore, most digital navigation systems provide limited guidance for selecting the most fuel-efficient route by accounting for the combined effects of waves, currents, and wind. Historical extreme events—including soliton waves, severe wind-generated waves, and vessel drift caused by currents and wind—are also rarely integrated into conventional navigation systems, despite their importance for voyage safety and operational planning.
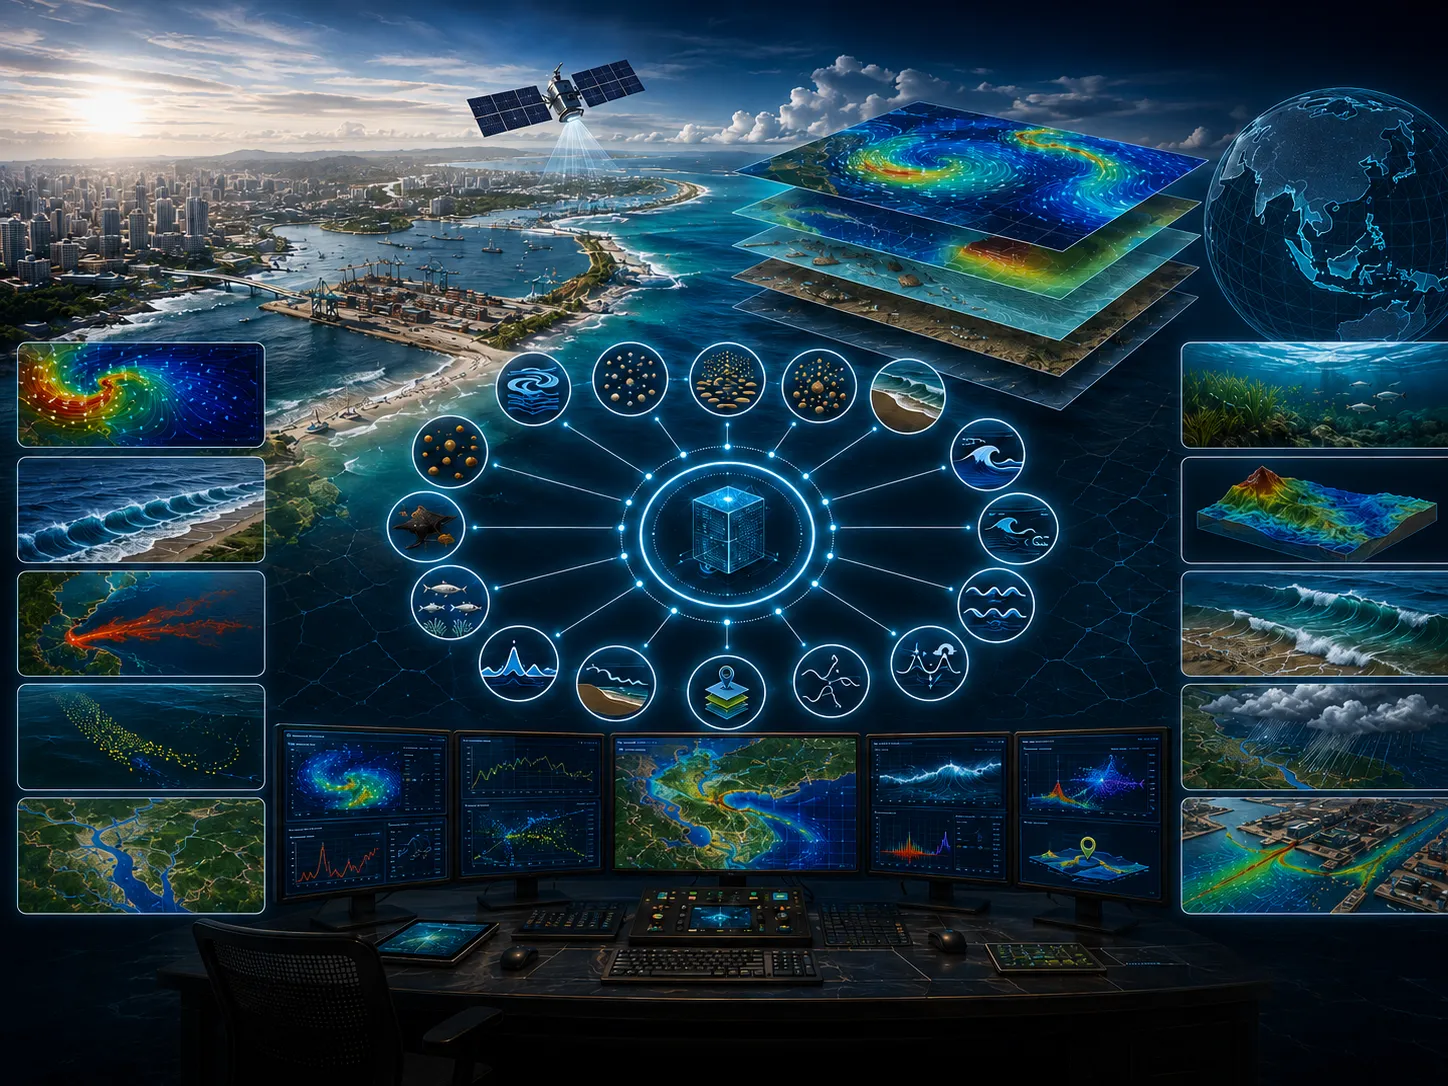
Marine modeling technology provides a comprehensive solution for shipping route determination. Monthly and seasonal patterns of waves, currents, and other oceanographic conditions can be simulated using numerical models. Climate variability and historical extreme marine events can also be analyzed and incorporated into the modeling framework. By integrating these simulation results with digital navigation charts, a comprehensive navigation support system can be developed. This integrated platform functions as a Decision Support System (DSS), providing scientifically based recommendations that improve ship safety, enhance operational efficiency, and support route selection, alternative routing, and safe approaches to destination ports.
The Hydrodynamic Model simulates current circulation and sea level along the planned shipping route, alternative routes, and destination port areas using representative monthly or seasonal wind conditions and regional tidal forcing. Model outputs are validated against in-situ observations through data assimilation techniques. The Spectral Wave Model simulates offshore wave conditions and identifies significant wave phenomena along the voyage. For coastal waters and harbor areas, Shallow Water Spectral Wave, Parabolic Mild Slope, Elliptic Mild Slope, and Boussinesq Wave Models simulate wave transformation and nearshore wave behavior. Finally, all modeling results are integrated with digital navigation charts using the Marine GIS Module, providing a spatially integrated decision-support platform for voyage planning.
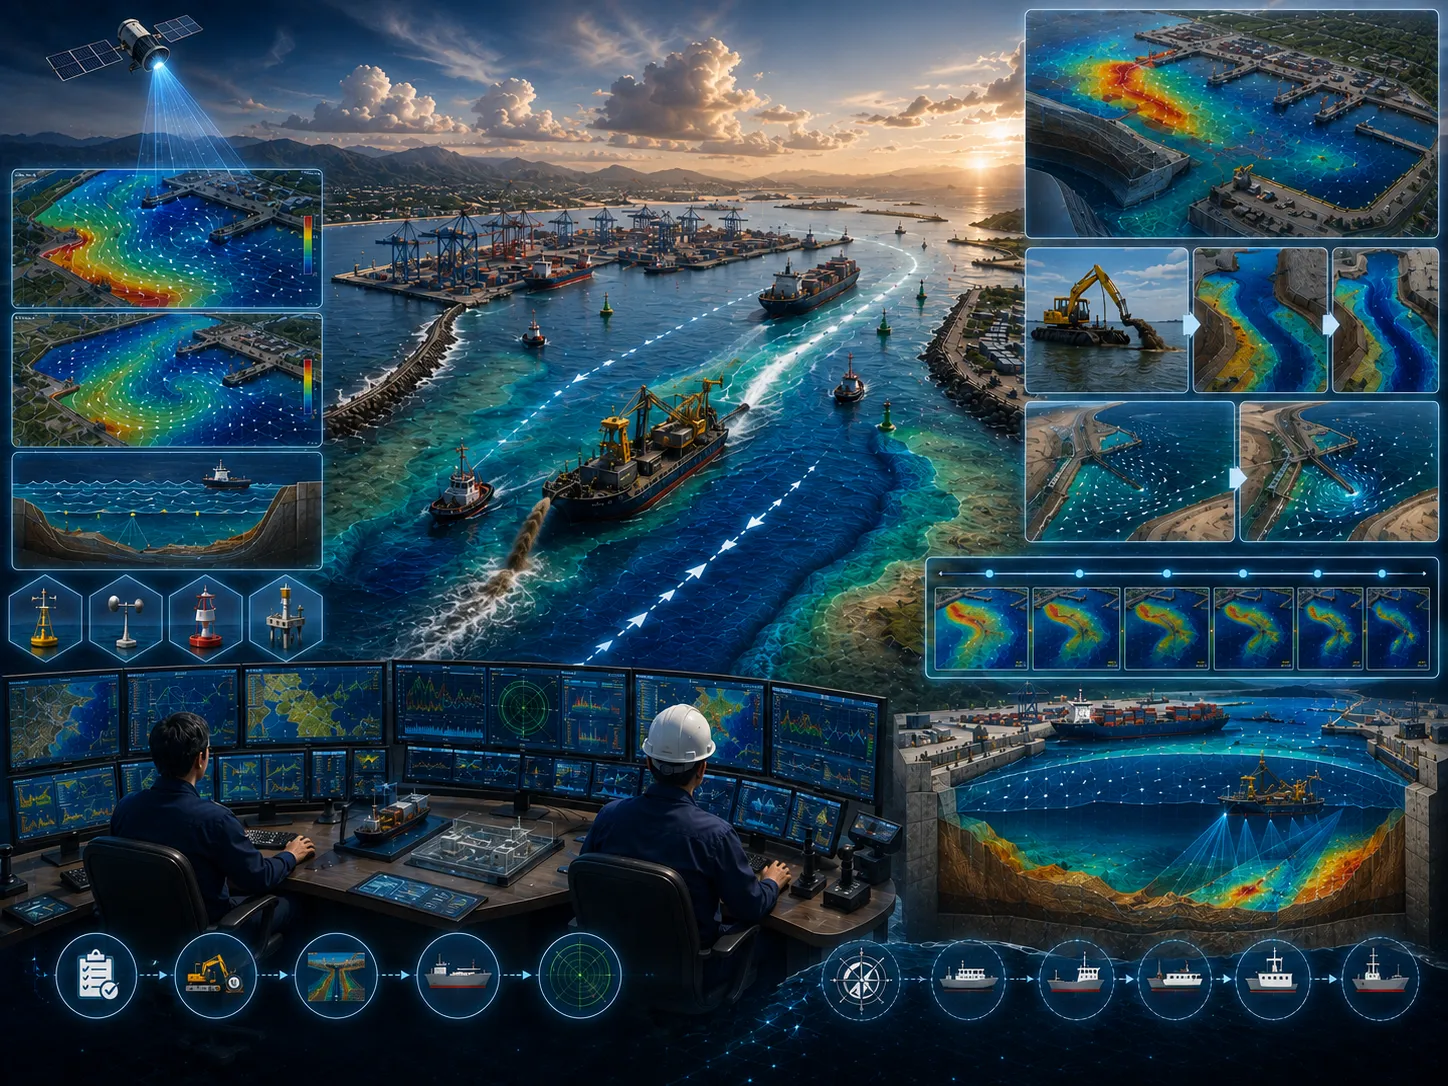
Designing a shipping channel within a port area requires careful and comprehensive planning.
Learn more →Shipping route optimization becomes essential when a vessel is already at sea and new information indicates that the planned route may be affected by adverse ocean conditions, severe weather (such as…
Learn more →The CORZ team will review the objective, scope, data availability, risk level, schedule, and required outputs to prepare a proportionate approach.
Share the location, objectives, key challenges, available data, and expected outputs. The CORZ team will help define a proportionate technical approach.