
CONTEXTField conditions and systems being assessed
Enter at least two characters.
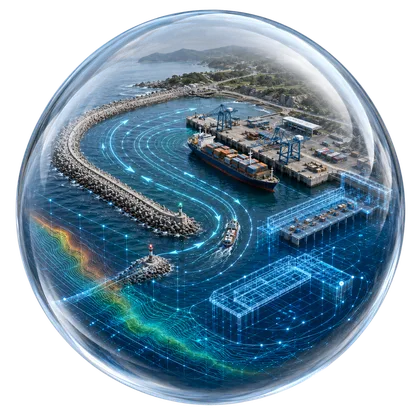
Port design and structural planning are highly complex engineering tasks. The ultimate objective is to develop a port that operates safely, efficiently, and reliably under dynamic marine conditions. An…
This page includes a one-page leaflet that can be opened in a full-image popup. It helps present the core CORZ service clearly and convincingly during project discussions, executive briefings, and decision-support meetings.
With a more proportional balance between visuals and text, the page feels brighter and more energetic while still keeping the important technical context visible and easy to understand.
Use this leaflet as a concise visual entry point before moving into the more detailed technical explanation.

Clarity before a decision is made
Port design and structural planning are highly complex engineering tasks. The ultimate objective is to develop a port that operates safely, efficiently, and reliably under dynamic marine conditions.
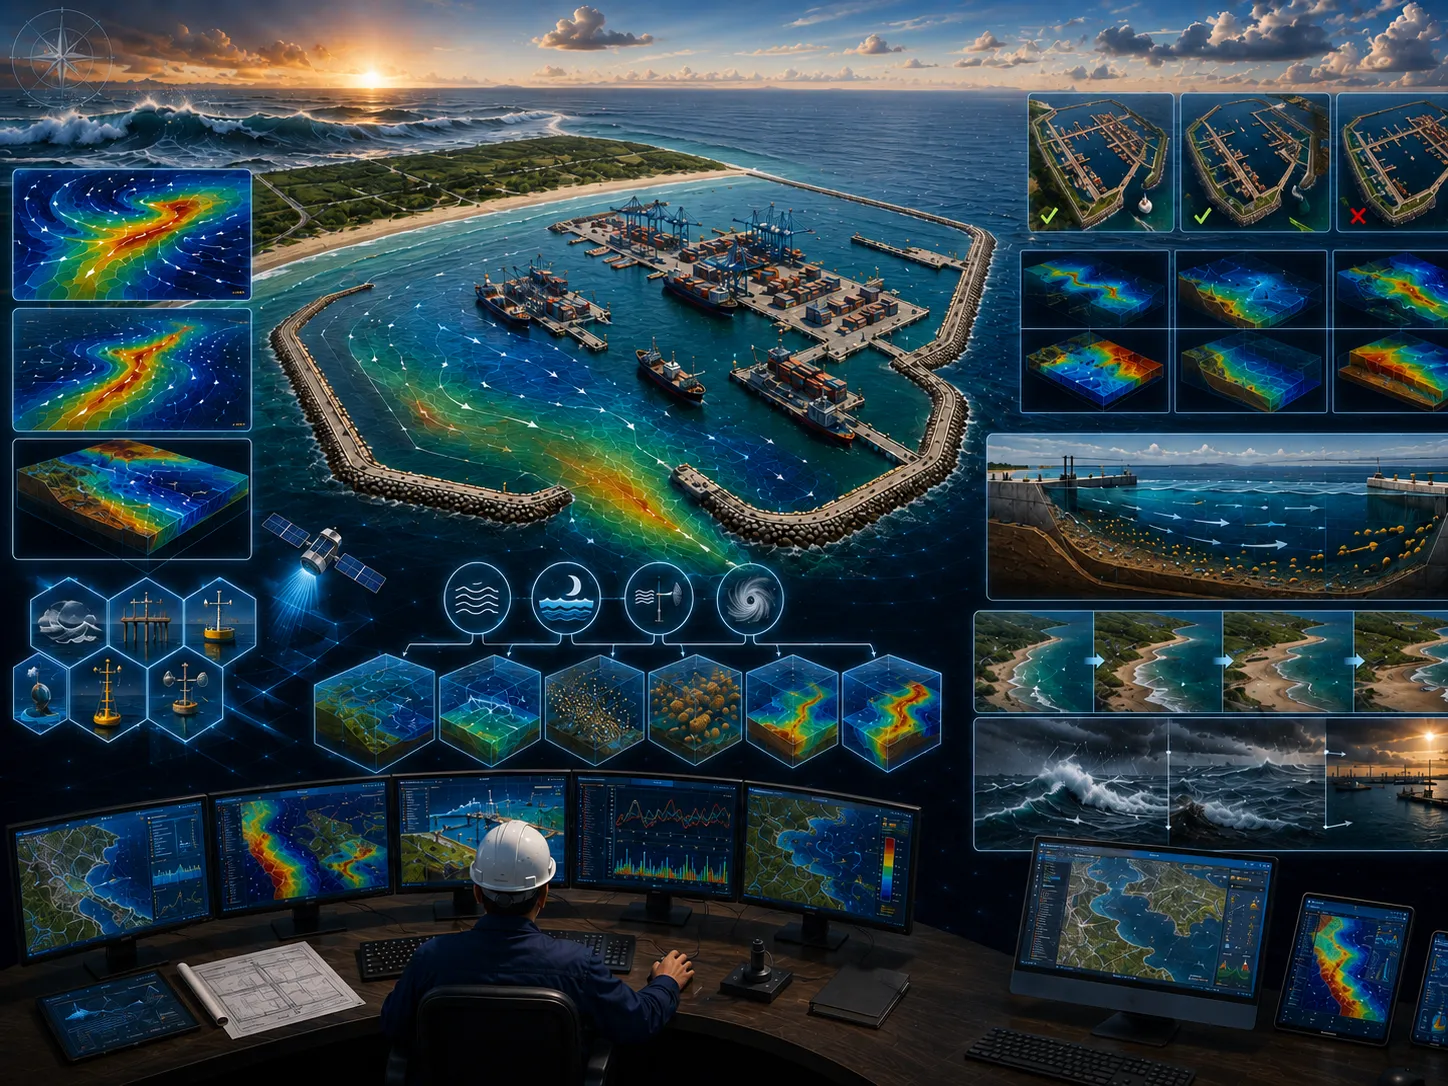
Marine numerical modeling provides a powerful decision-support tool by simulating a wide range of environmental conditions, including wind-generated waves and currents, tidal circulation, hydrodynamic patterns influenced by harbor geometry and bathymetry, sediment transport, and shoreline evolution. Multiple design alternatives can be evaluated under both normal and extreme scenarios to identify the most effective harbor configuration.
Define the approach, priorities, and actions for port design optimization using traceable evidence.
Environmental impact, design failure, operational disruption, uncontrolled cost, and weak assumptions.
Comparable options, quantified risk, and implementable recommendations.
This aspect is assessed to clarify its implications for port design optimization.
This aspect is assessed to clarify its implications for port design optimization.
This aspect is assessed to clarify its implications for port design optimization.

This aspect is assessed to clarify its implications for port design optimization.

This aspect is assessed to clarify its implications for port design optimization.
This aspect is assessed to clarify its implications for port design optimization.

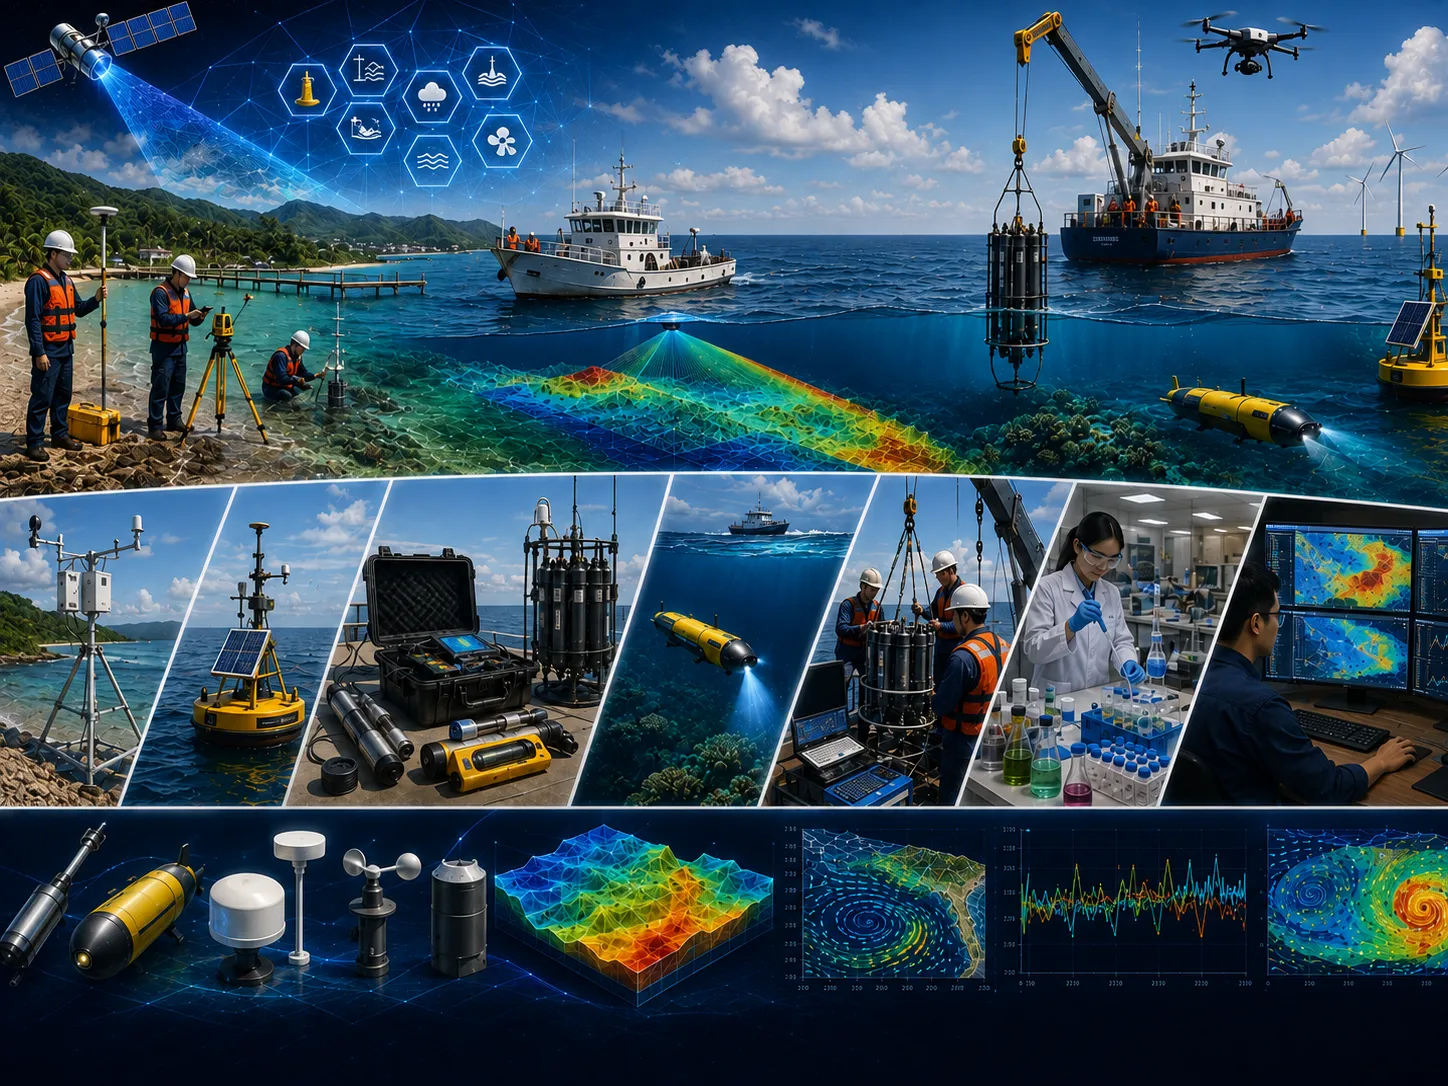
Field surveys, in-situ measurements, laboratory results, historical records, and operating information as required.
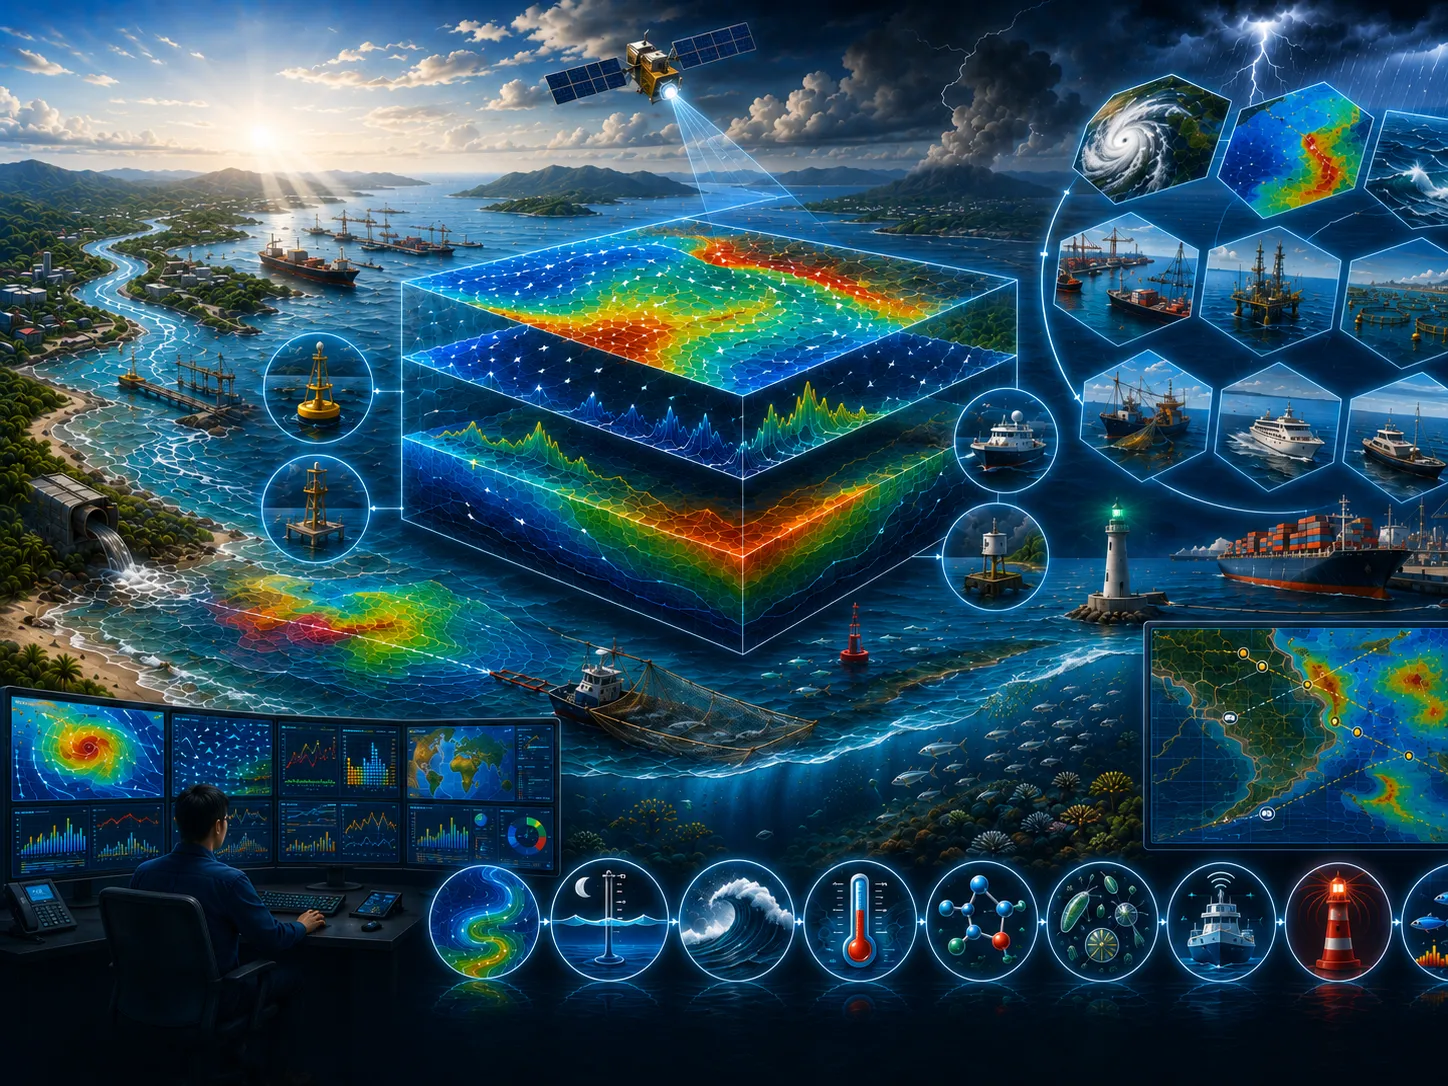
Satellite imagery, mapping, spatial analysis, temporal change, and integration of multiple data sources.
Model setup, calibration, validation, existing–planned–extreme scenarios, and sensitivity analysis.
Metadata, quality controls, assumptions, limitations, data versions, and processing lineage are documented.
Objectives, study area, available data, additional needs, initial risks, and recommended level of detail.
Quality-controlled data, thematic maps, time series, indicators, and comparable visualizations.
Comparison of existing conditions, alternatives, extremes, sensitivities, consequences, and mitigation options.
Methods, results, limitations, recommendations, action priorities, and stakeholder presentation materials.
Assumptions, data, variability, and limitations are stated so decision risk is not hidden.
Alternative locations, designs, operations, or policies are assessed using consistent indicators.
Data needs and analysis depth are proportionate to risk so resources are used efficiently.
Findings and recommendations are transparent for technical, management, regulatory, and partner review.
Objectives, users, location, project phase, problems, constraints, and the decision to support.
Methods, data, surveys, models, schedule, team, deliverables, review gates, and resource estimate.
Collection, inspection, harmonization, documentation, and data-sufficiency assessment.
Processing, modeling, validation, option comparison, sensitivity, and risk evaluation.
Maps, report, executive brief, presentation, supporting data, and follow-up plan.
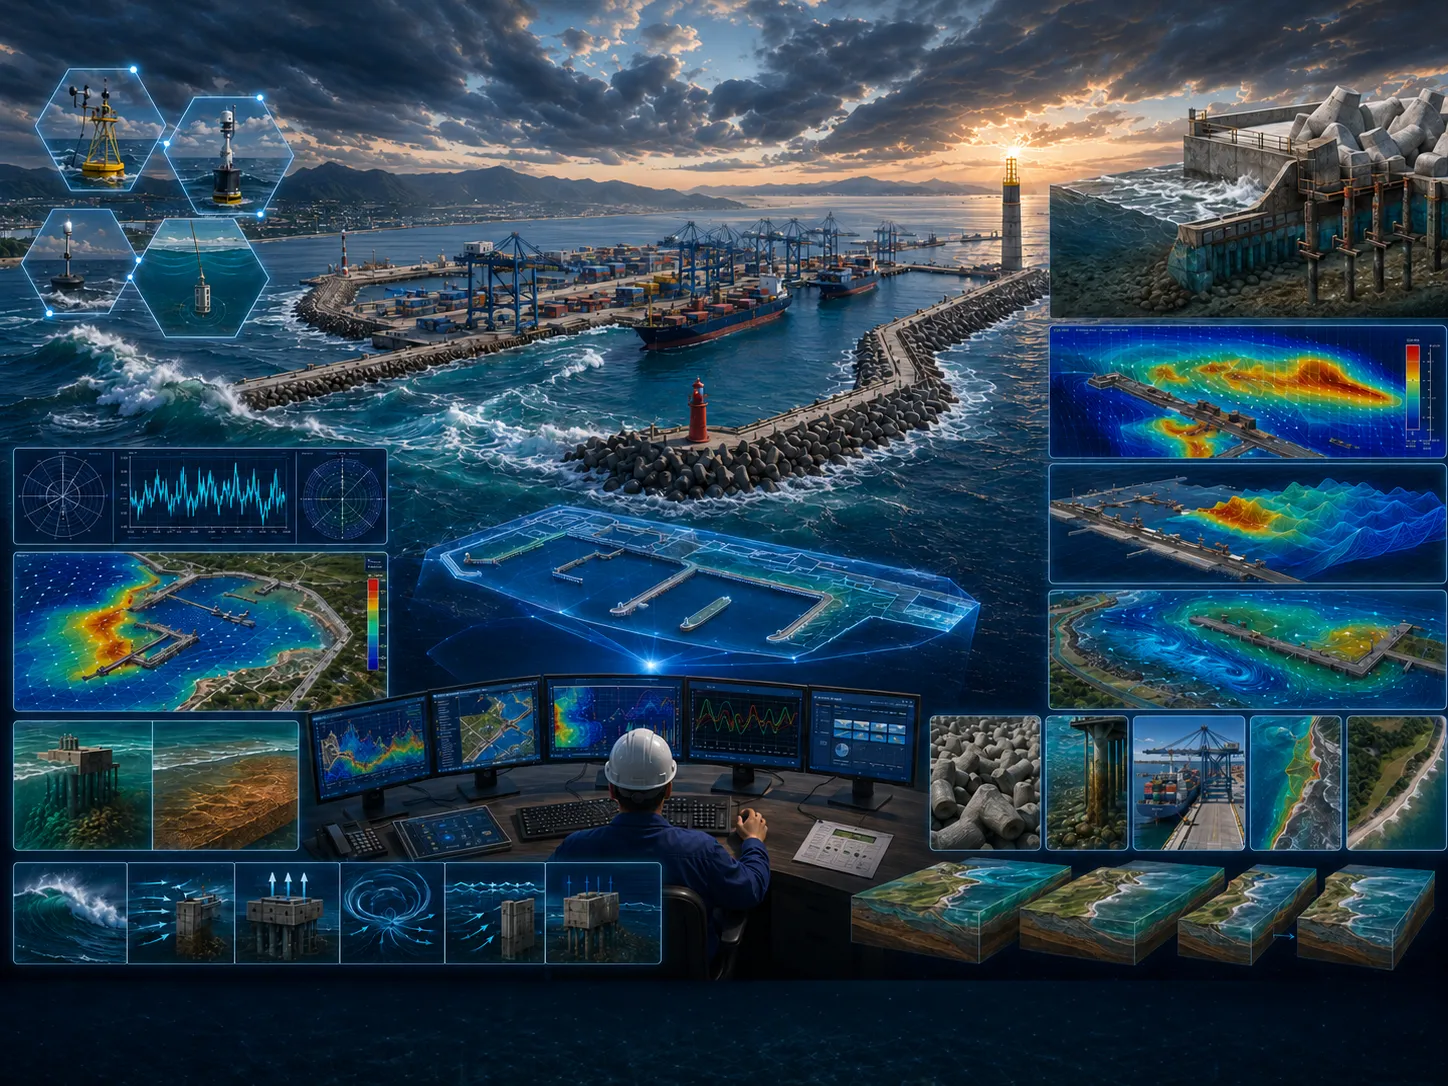
Port design and structural planning are highly complex engineering tasks. The ultimate objective is to develop a port that operates safely, efficiently, and reliably under dynamic marine conditions. An optimal port design provides an effective layout for vessel navigation, cargo handling, protected anchorage, and other operational activities while accounting for wave climate, tidal dynamics, sediment transport, shoreline evolution, and coastal circulation. Therefore, a comprehensive understanding of the site's oceanographic conditions is essential before construction begins.
Marine numerical modeling provides a powerful decision-support tool by simulating a wide range of environmental conditions, including wind-generated waves and currents, tidal circulation, hydrodynamic patterns influenced by harbor geometry and bathymetry, sediment transport, and shoreline evolution. Multiple design alternatives can be evaluated under both normal and extreme scenarios to identify the most effective harbor configuration. Extreme-event simulations—including severe storms, extreme high tides, and tsunami events—allow engineers to assess the resilience of each proposed layout. The result is an optimized port design that delivers operational efficiency while maintaining structural integrity and long-term reliability.
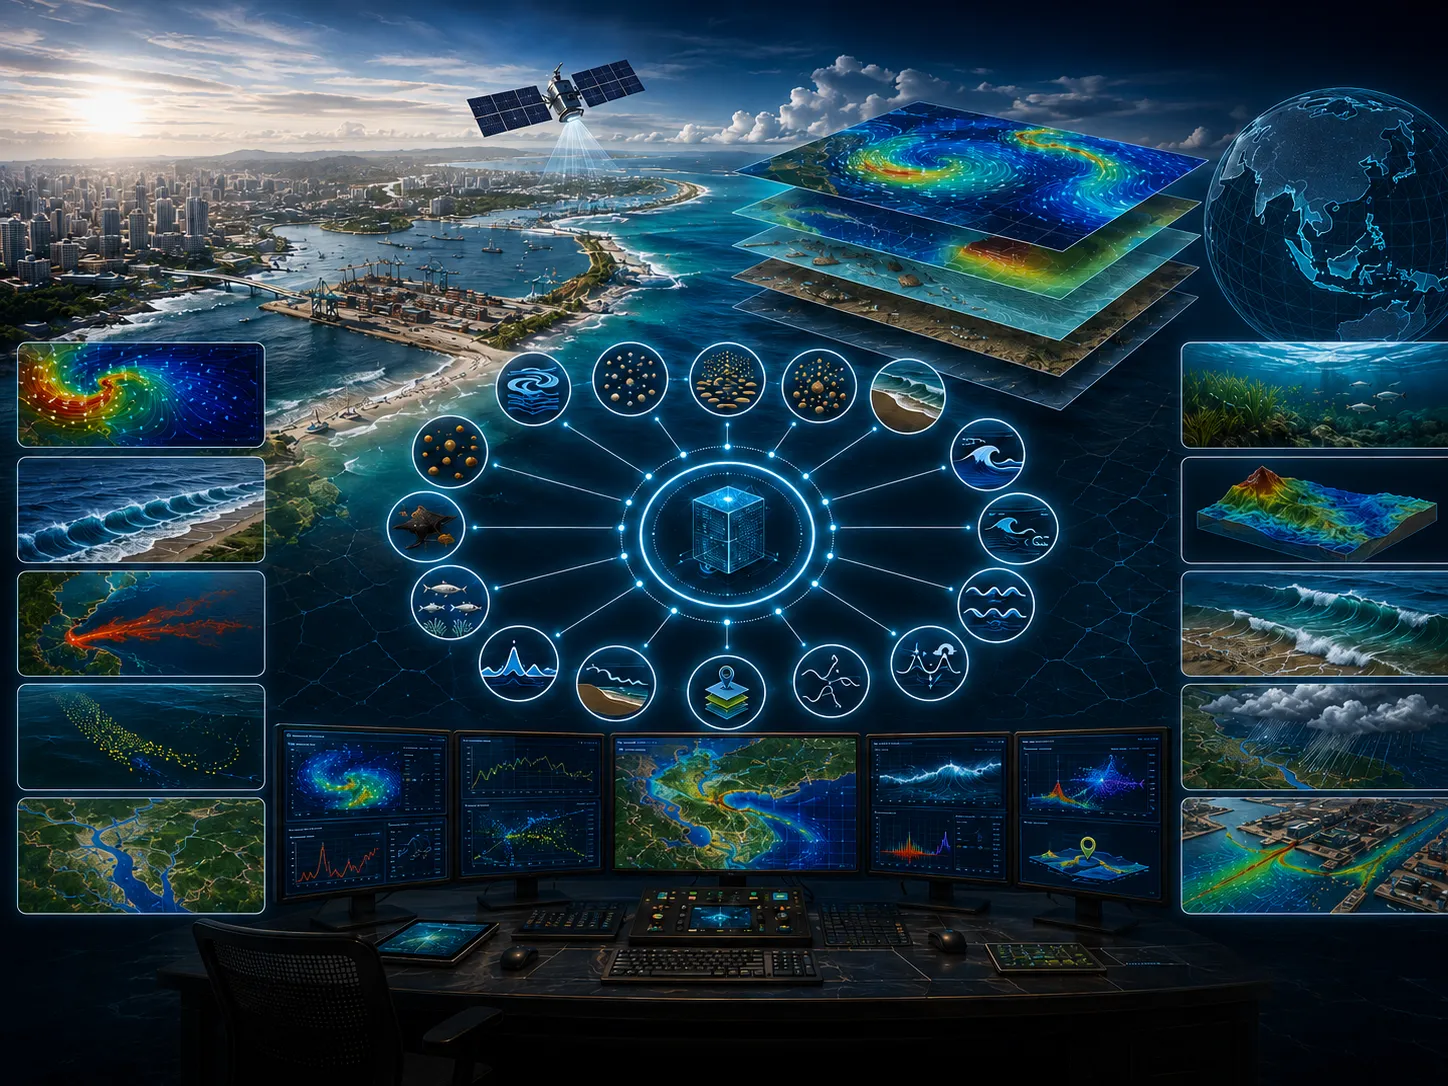
The Hydrodynamic Model is used to simulate current circulation and sea-level variations. Wave conditions and their associated processes are analyzed using the Spectral Wave Model, Wave Refraction–Diffraction Model, Boussinesq Wave Model, and Wave Analysis Toolkit, which extract and interpret detailed wave characteristics from field observations and numerical simulations. Sediment transport, deposition, and potential shoaling areas are evaluated using the Bed Sediment Transport Model, Suspended Sediment Transport Model, and Particle Tracking Model. Potential shoreline evolution is assessed using the Coastal Morphology Model. For real-time monitoring and integrated decision support, the Marine GIS platform combines observational datasets, numerical model outputs, and spatial information into a unified geospatial system. Marine GIS also supports integrated mapping and spatial planning throughout the port design process.
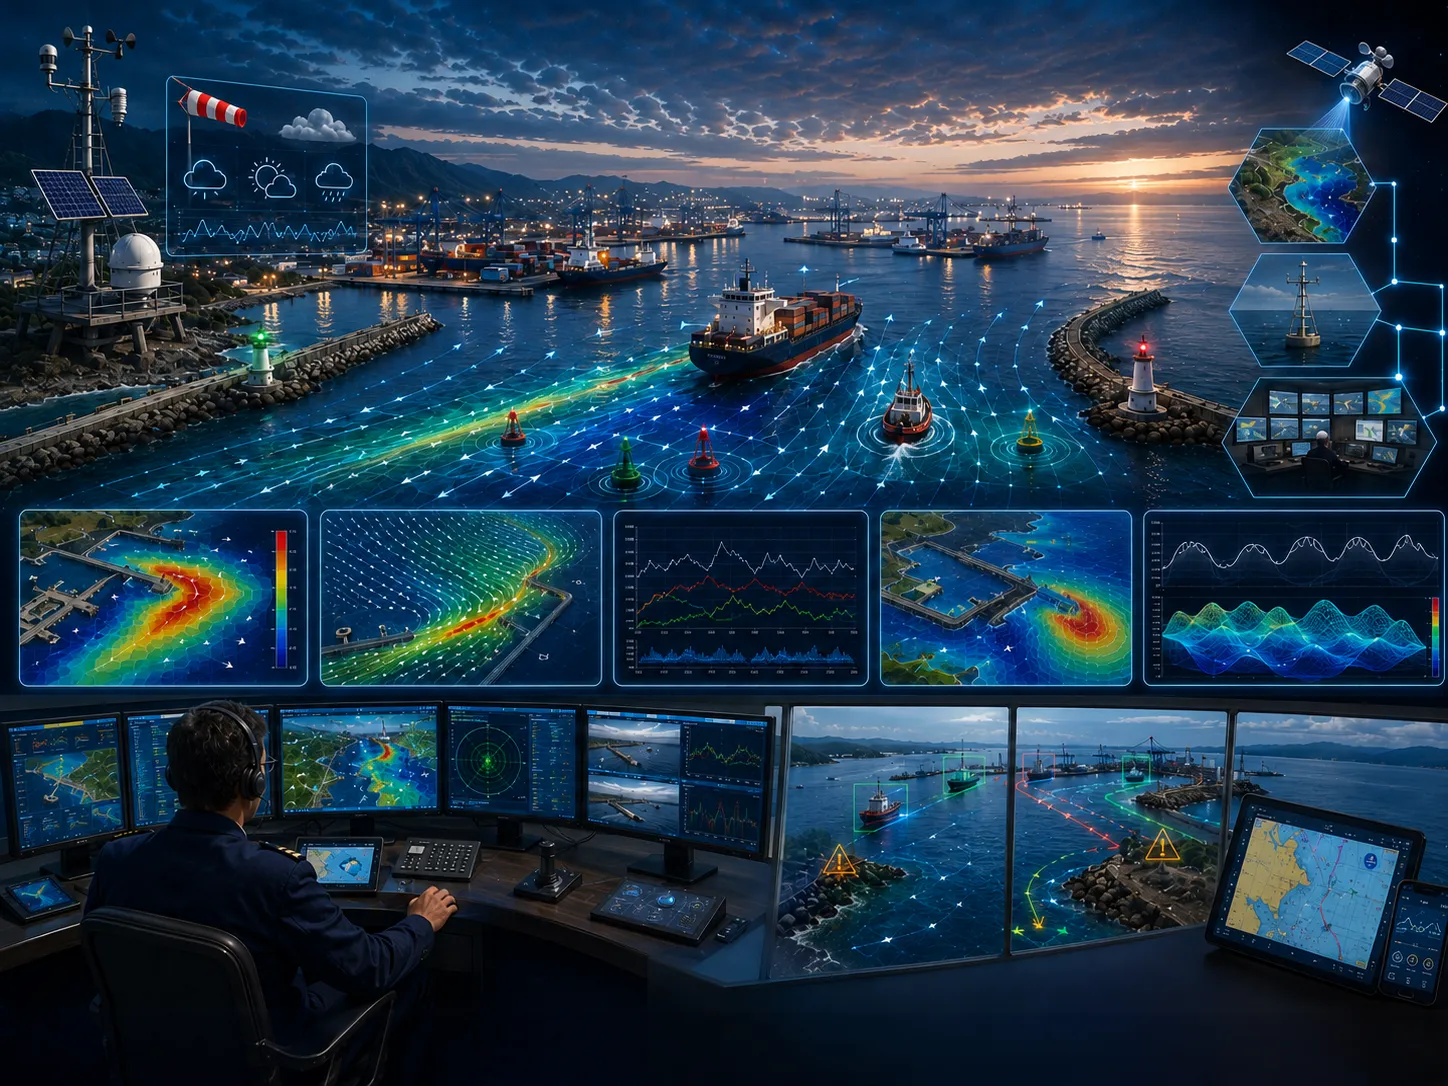
Port safety against external marine conditions and navigation safety for vessels entering and leaving the harbor are essential components of modern port management.
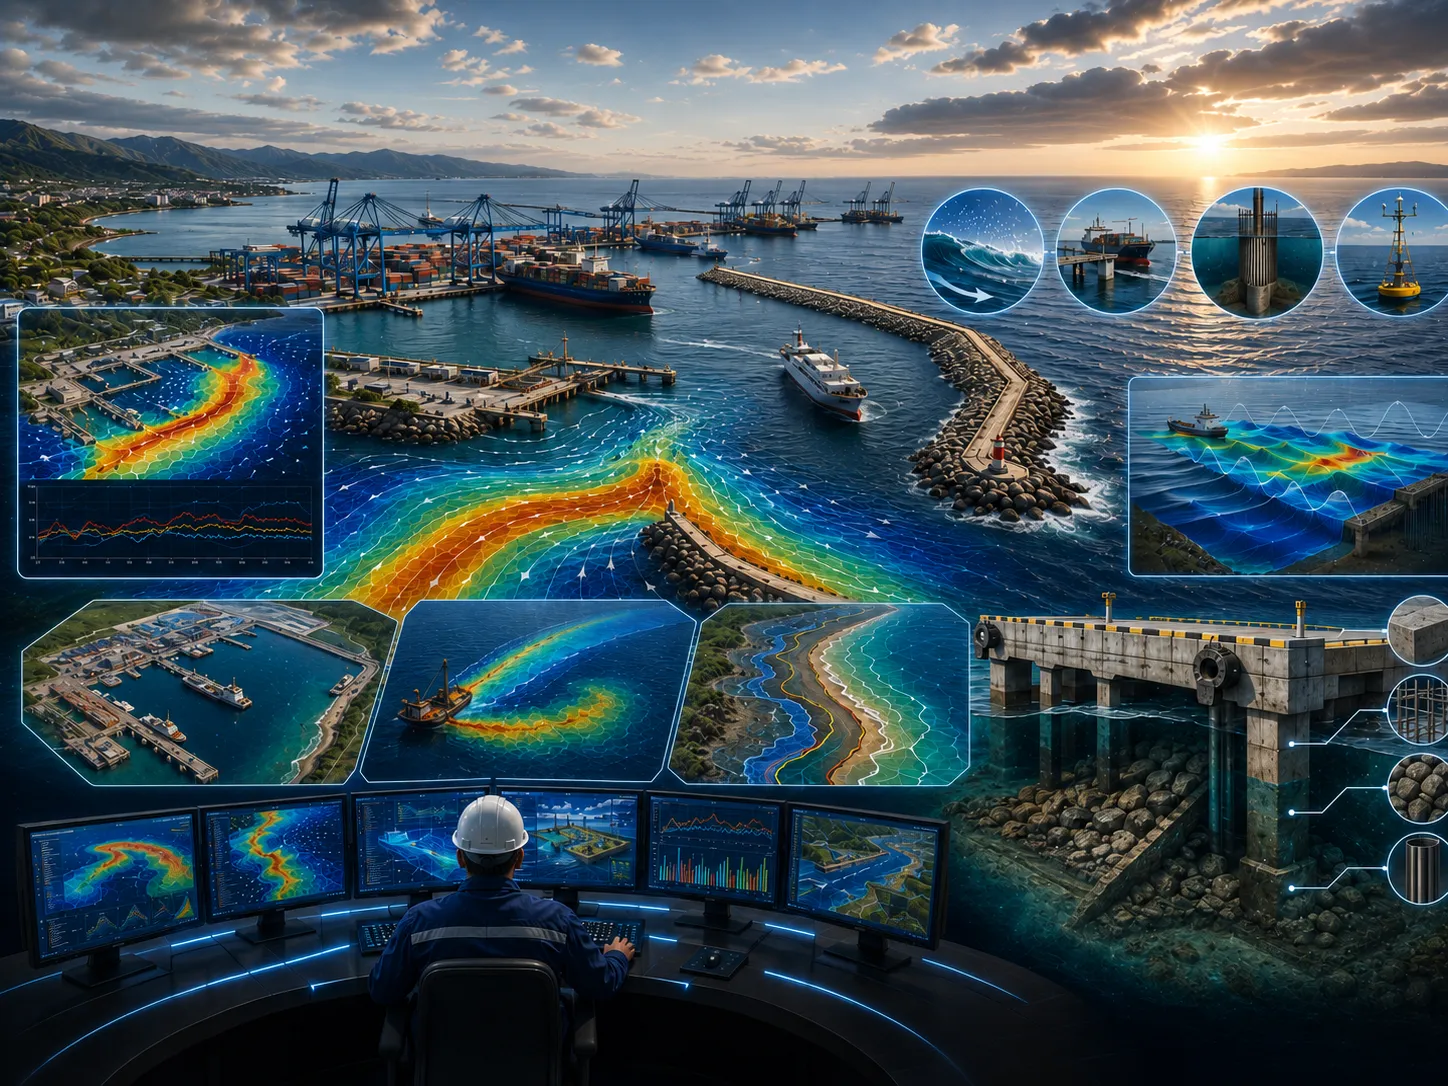
Learn more →Evaluating the structural strength of port infrastructure is a complex engineering task. Port layouts must maximize operational efficiency while minimizing the footprint of structural components, leaving…
Learn more →The CORZ team will review the objective, scope, data availability, risk level, schedule, and required outputs to prepare a proportionate approach.
Share the location, objectives, key challenges, available data, and expected outputs. The CORZ team will help define a proportionate technical approach.