
CONTEXTField conditions and systems being assessed
Enter at least two characters.
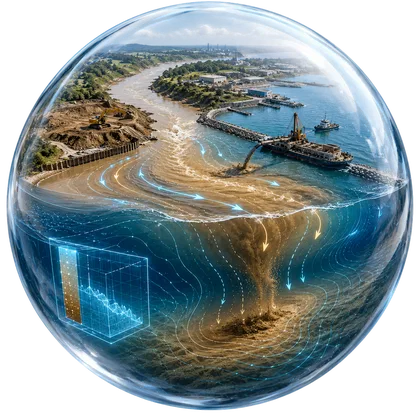
Sedimentation in aquatic environments resulting from human activities can have significant impacts on water quality, ecosystem health, and coastal sustainability.
This page includes a one-page leaflet that can be opened in a full-image popup. It helps present the core CORZ service clearly and convincingly during project discussions, executive briefings, and decision-support meetings.
With a more proportional balance between visuals and text, the page feels brighter and more energetic while still keeping the important technical context visible and easy to understand.
Use this leaflet as a concise visual entry point before moving into the more detailed technical explanation.
Clarity before a decision is made
Sedimentation in aquatic environments resulting from human activities can have significant impacts on water quality, ecosystem health, and coastal sustainability.
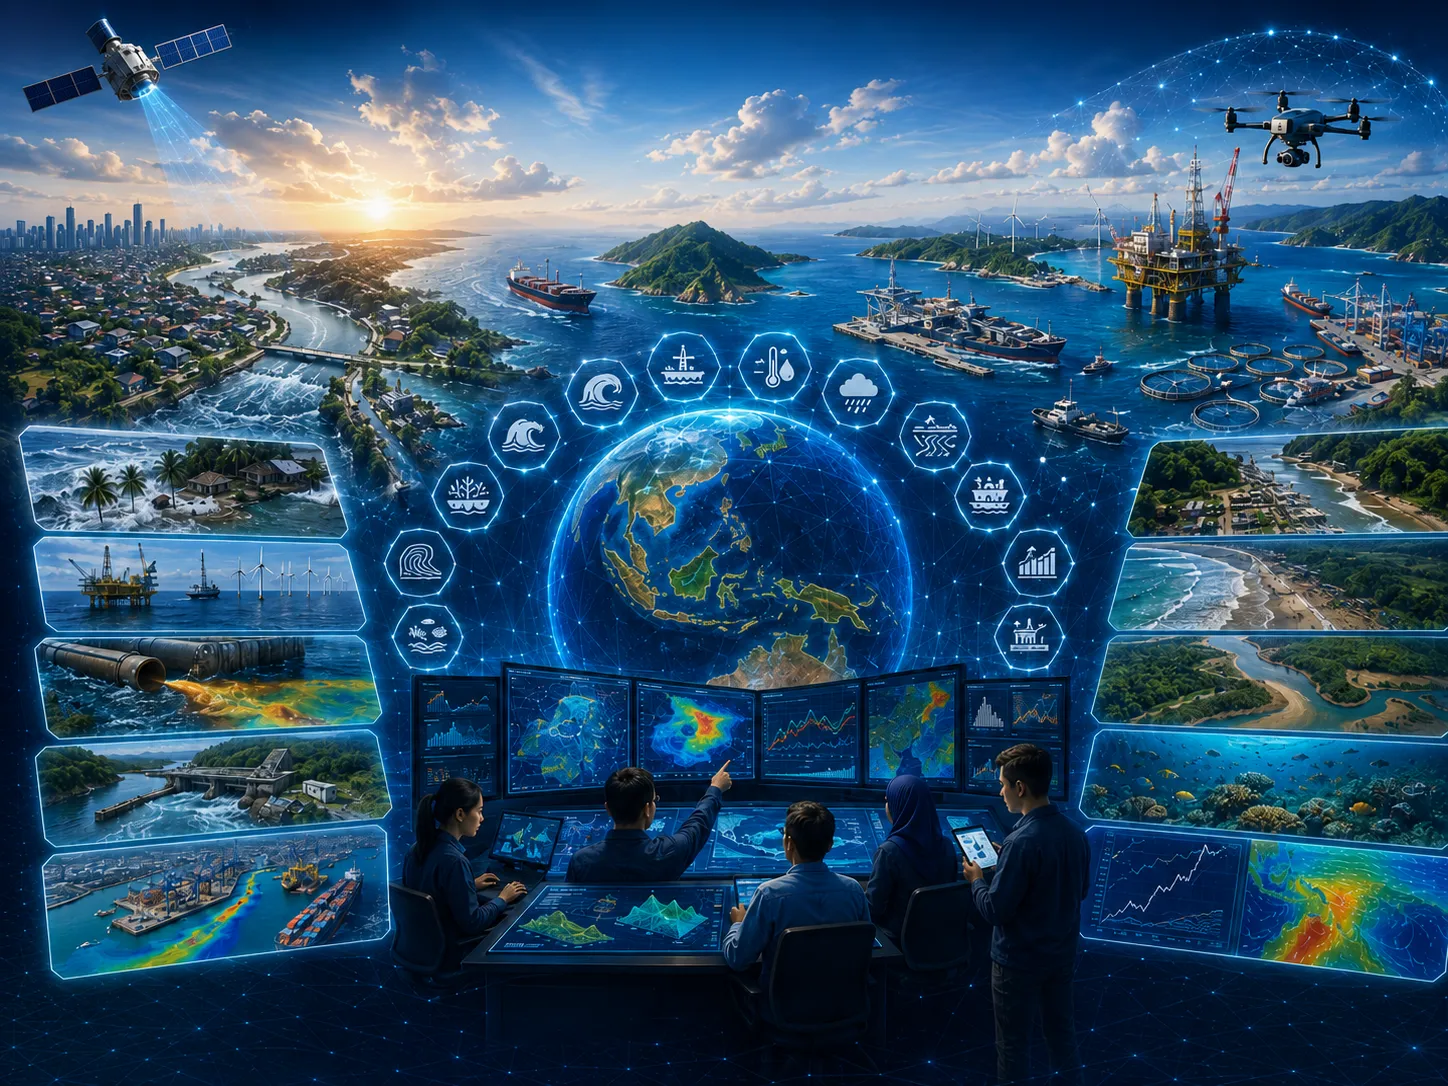
These adverse impacts can be significantly reduced through the application of advanced numerical modeling. Modeling technologies provide a scientific framework for identifying sediment sources associated with human activities and evaluating their relative contributions to sediment loading in coastal waters.
Define the approach, priorities, and actions for sedimentation using traceable evidence.
Environmental impact, design failure, operational disruption, uncontrolled cost, and weak assumptions.
Comparable options, quantified risk, and implementable recommendations.
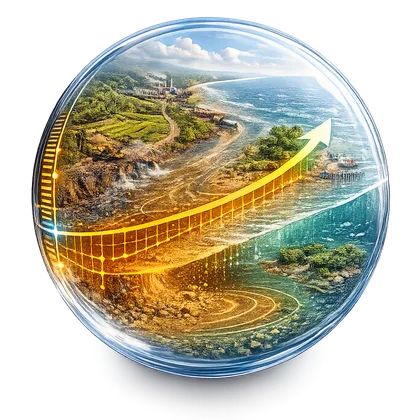
River sedimentation resulting from human activities throughout a watershed is one of the largest contributors to sediment accumulation in estuaries and coastal waters.
Learn more →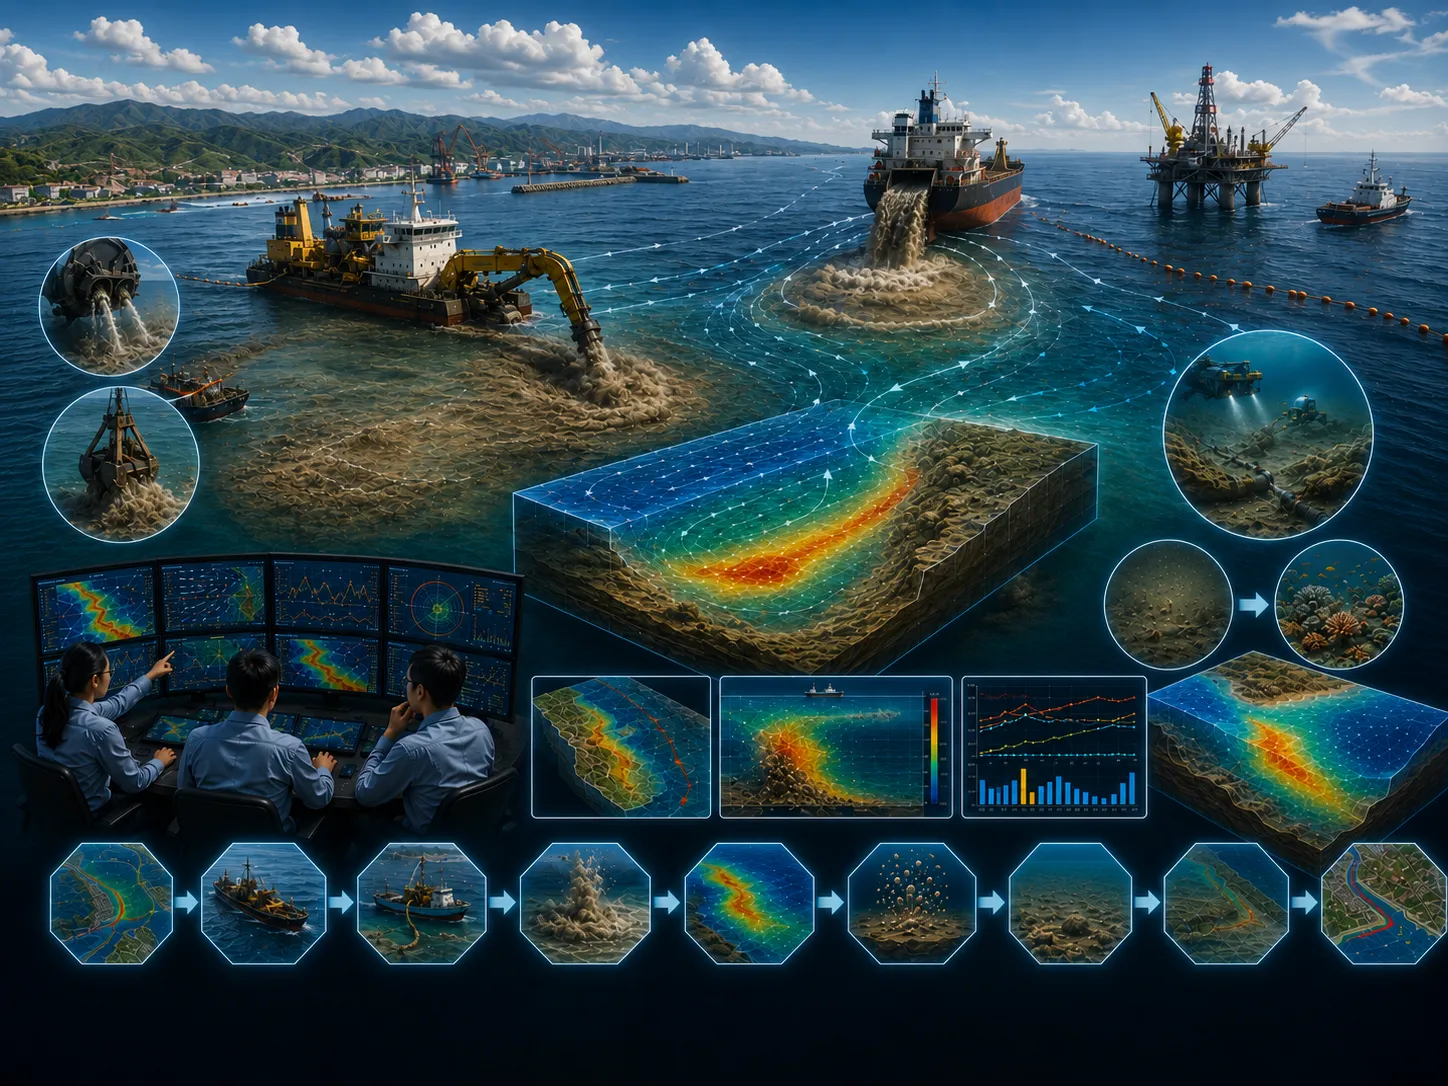
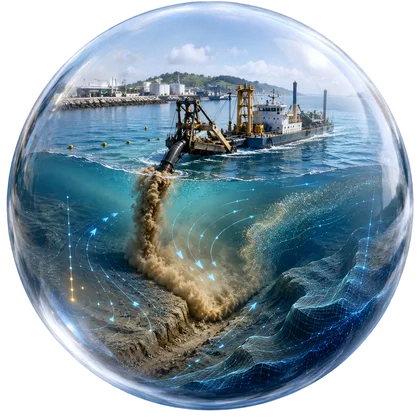
Sedimentation generated during marine dredging operations may occur both during the dredging process and during offshore disposal (dumping) of dredged materials.
Learn more →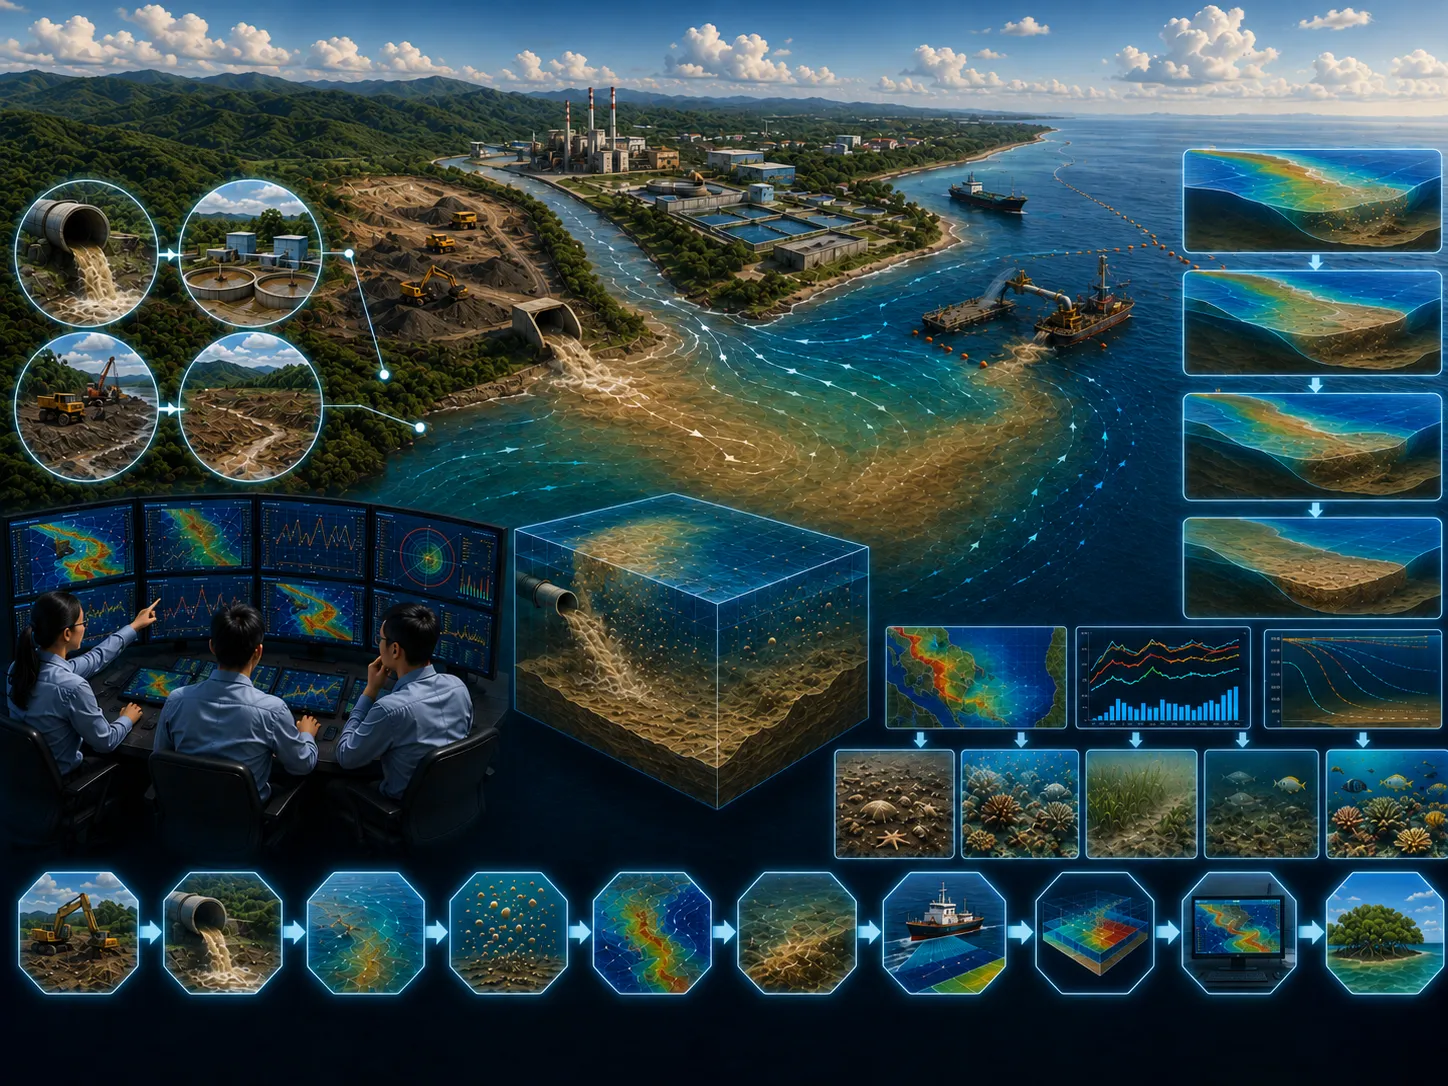
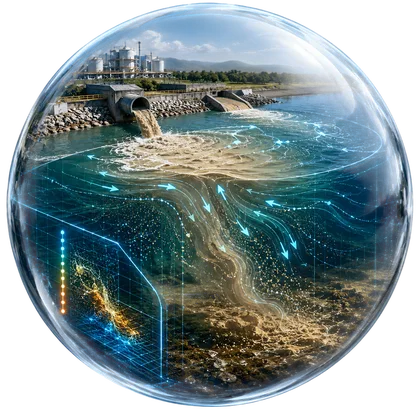
Sediment discharged into aquatic environments originates from a variety of human activities, including mineral extraction, industrial processes that generate sediment through settling or clarification…
Learn more →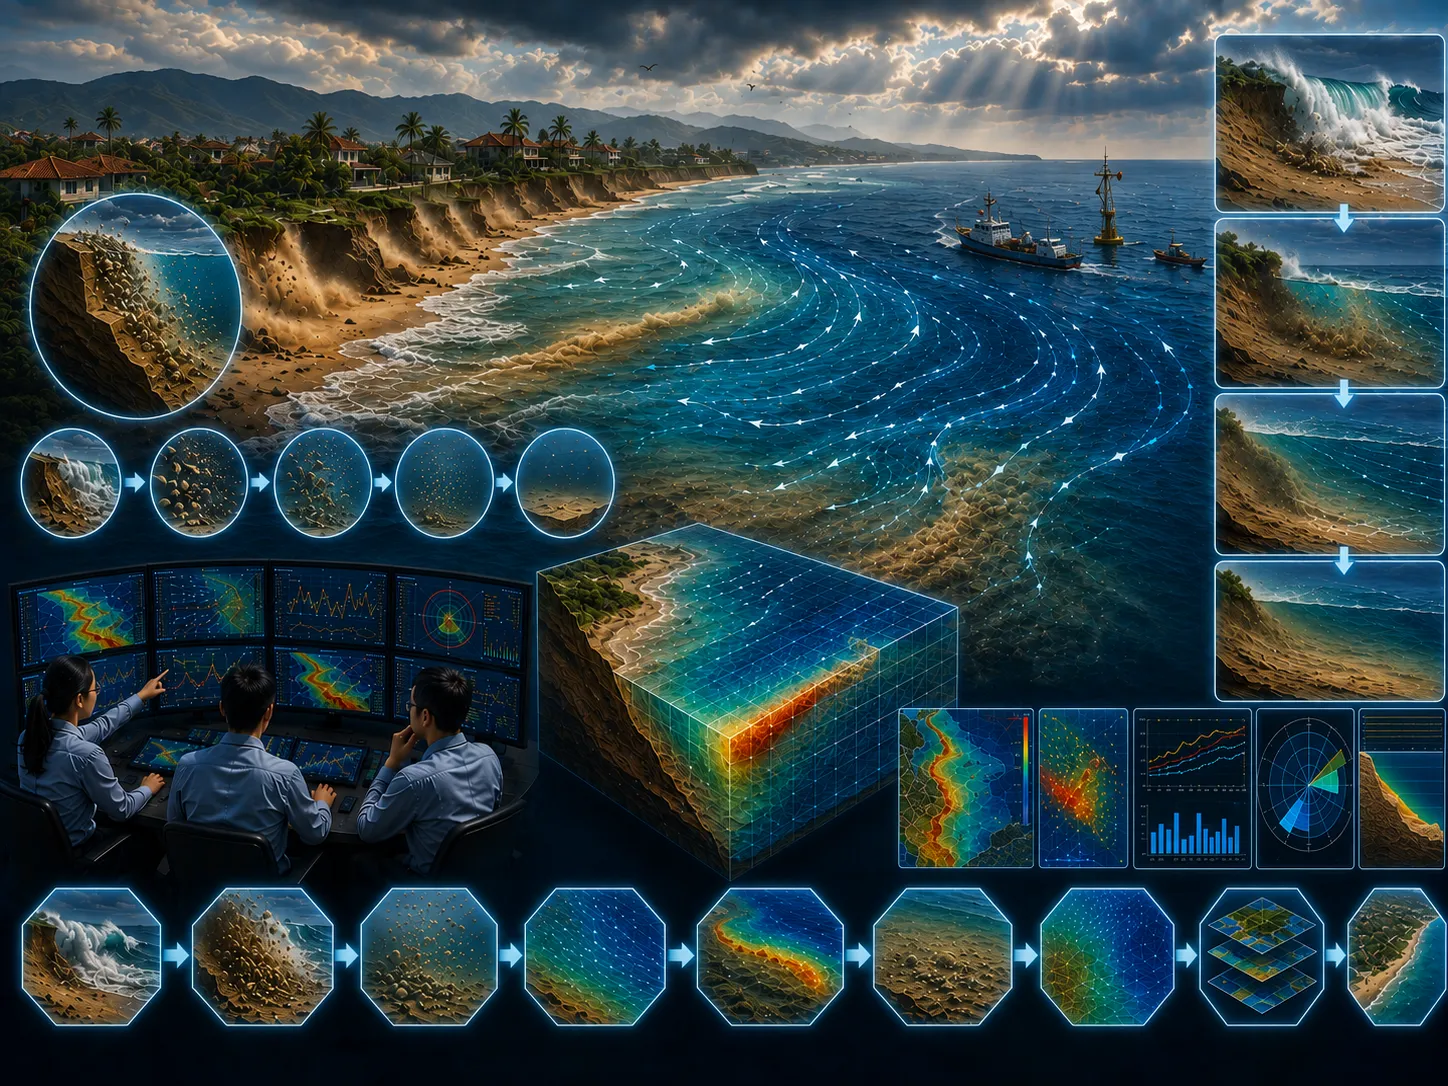
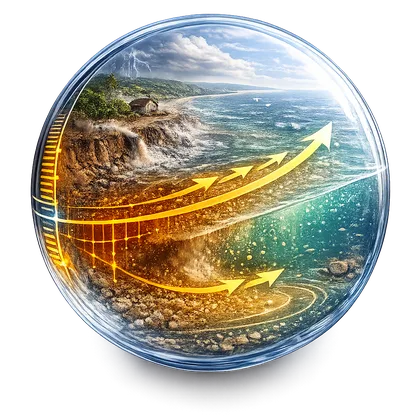
Coastal erosion sedimentation is the process by which large sediment particles are broken down into smaller grains by the continuous action of waves and coastal currents.
Learn more →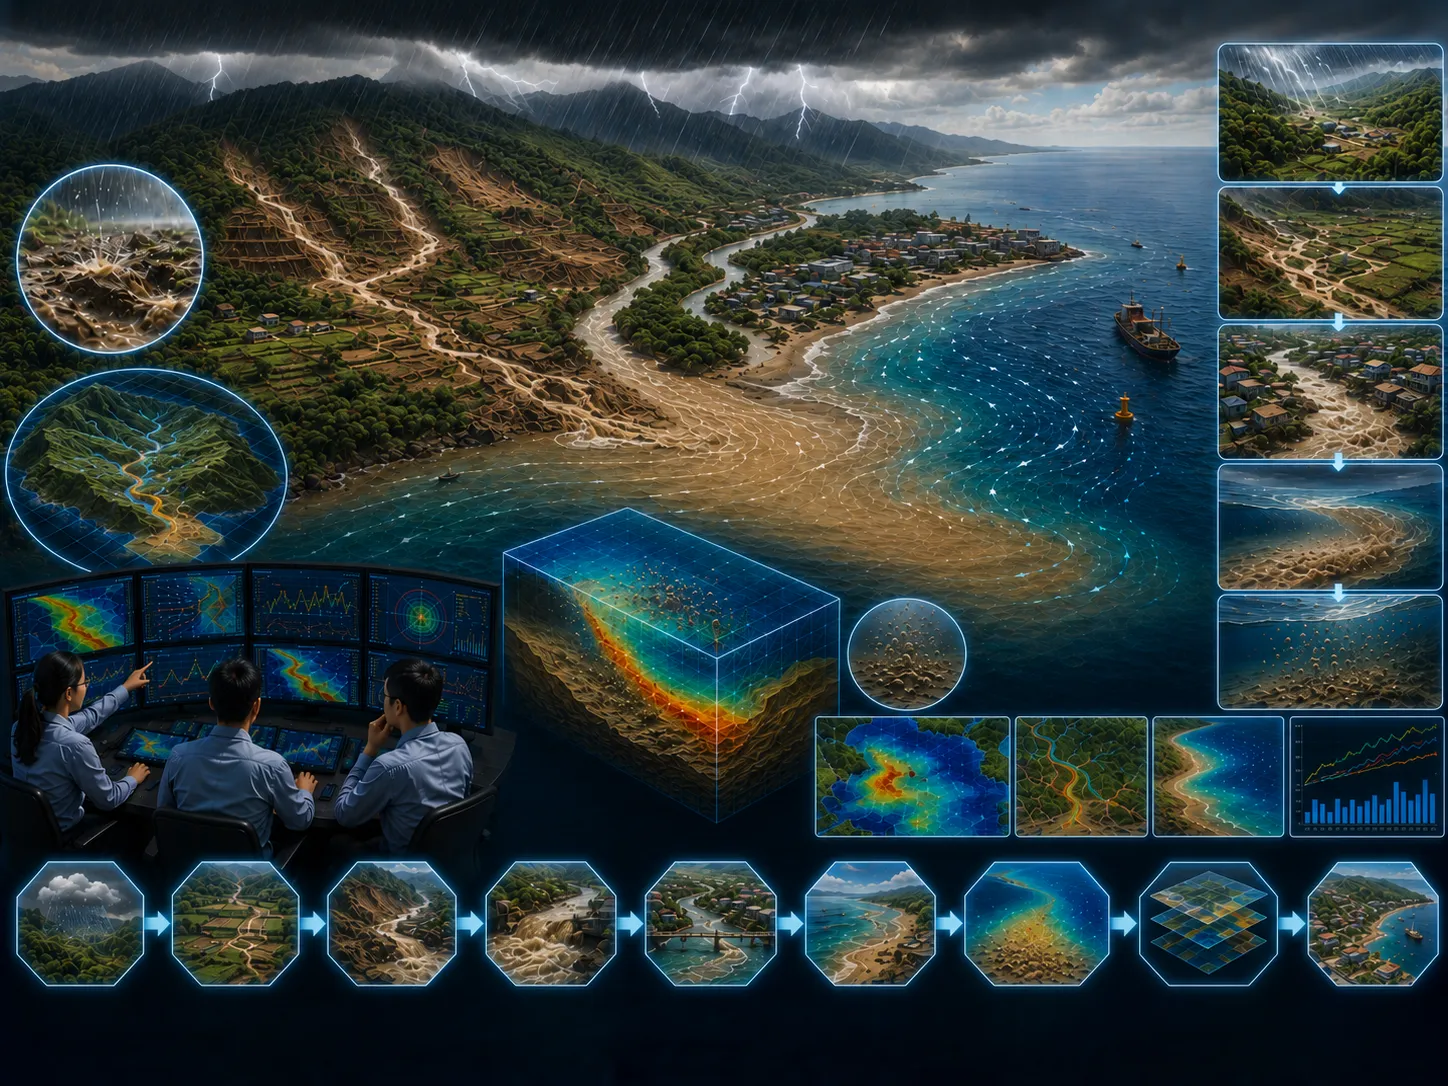
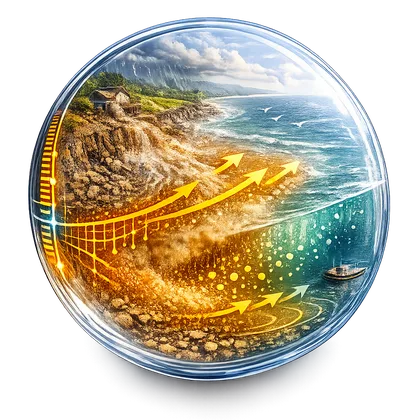
Surface runoff transports sediment particles from the land into adjacent coastal waters. This process is primarily driven by intense rainfall, which generates overland flow toward the coast. As runoff moves…
Learn more →Field surveys, in-situ measurements, laboratory results, historical records, and operating information as required.
Satellite imagery, mapping, spatial analysis, temporal change, and integration of multiple data sources.
Model setup, calibration, validation, existing–planned–extreme scenarios, and sensitivity analysis.
Metadata, quality controls, assumptions, limitations, data versions, and processing lineage are documented.
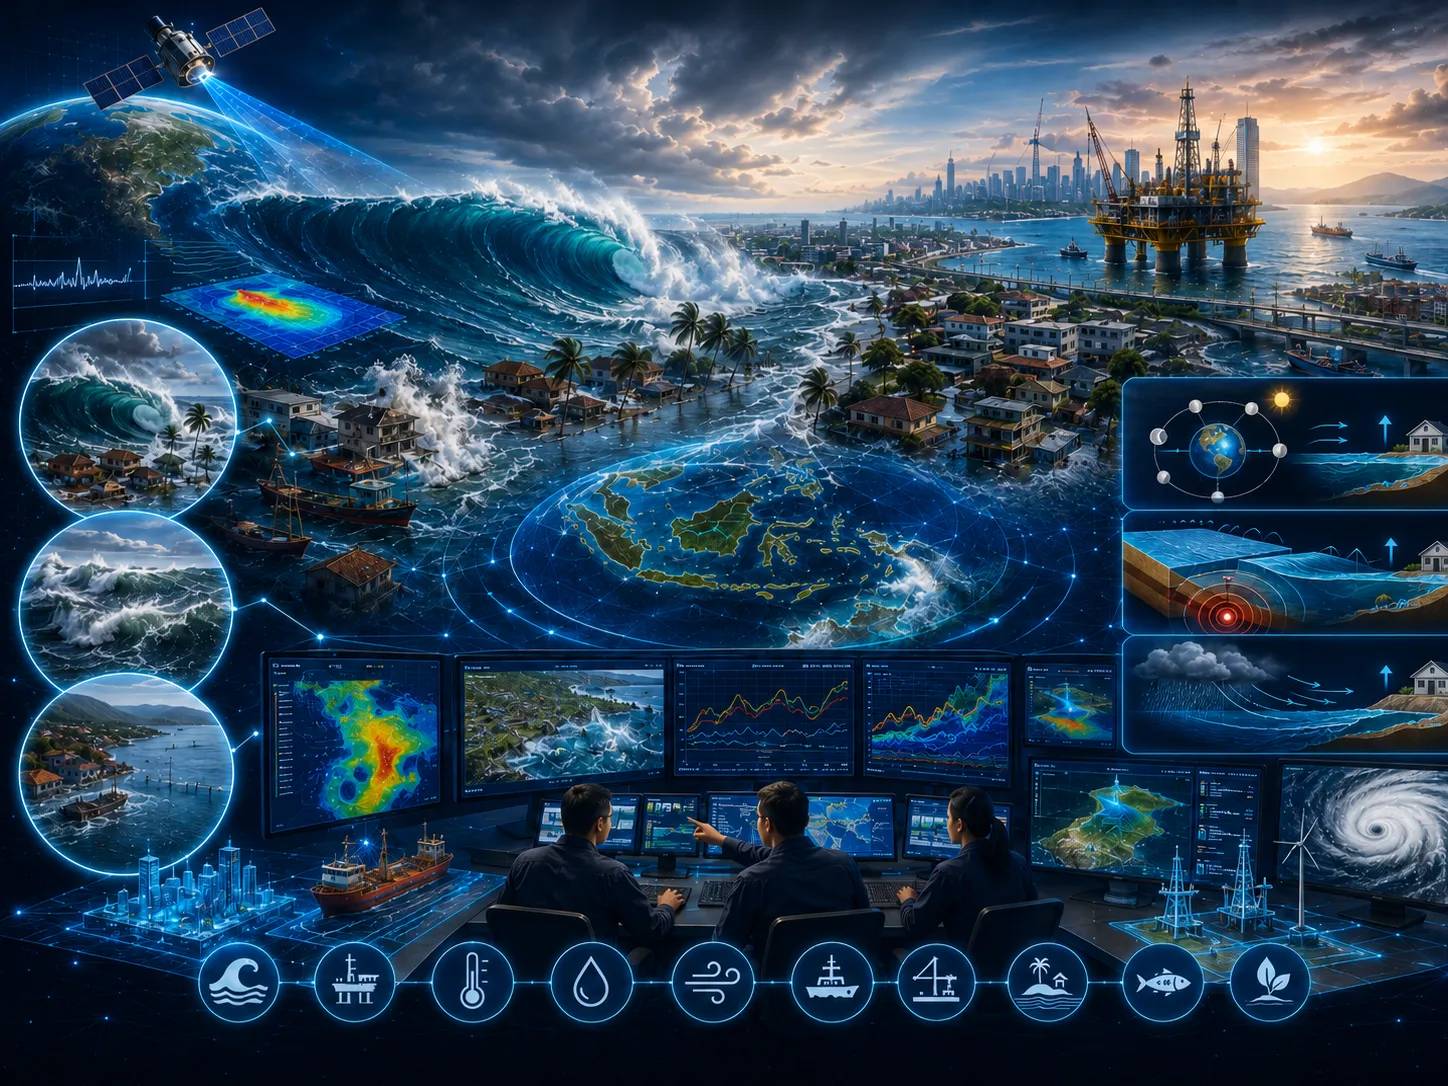
Objectives, study area, available data, additional needs, initial risks, and recommended level of detail.
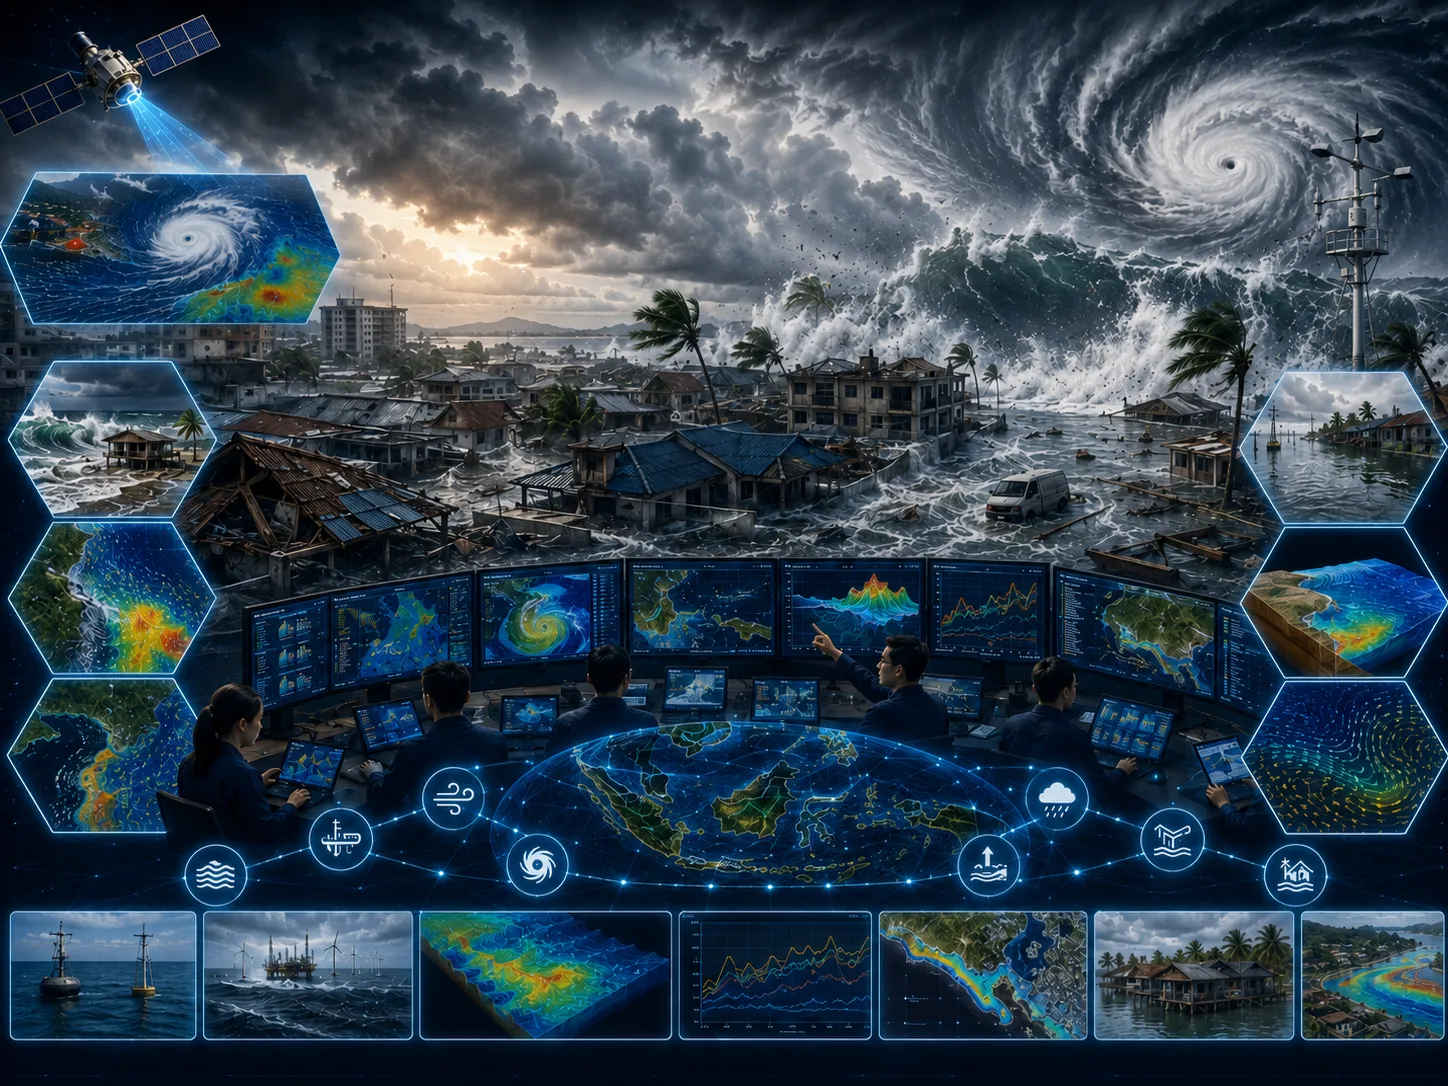
Quality-controlled data, thematic maps, time series, indicators, and comparable visualizations.
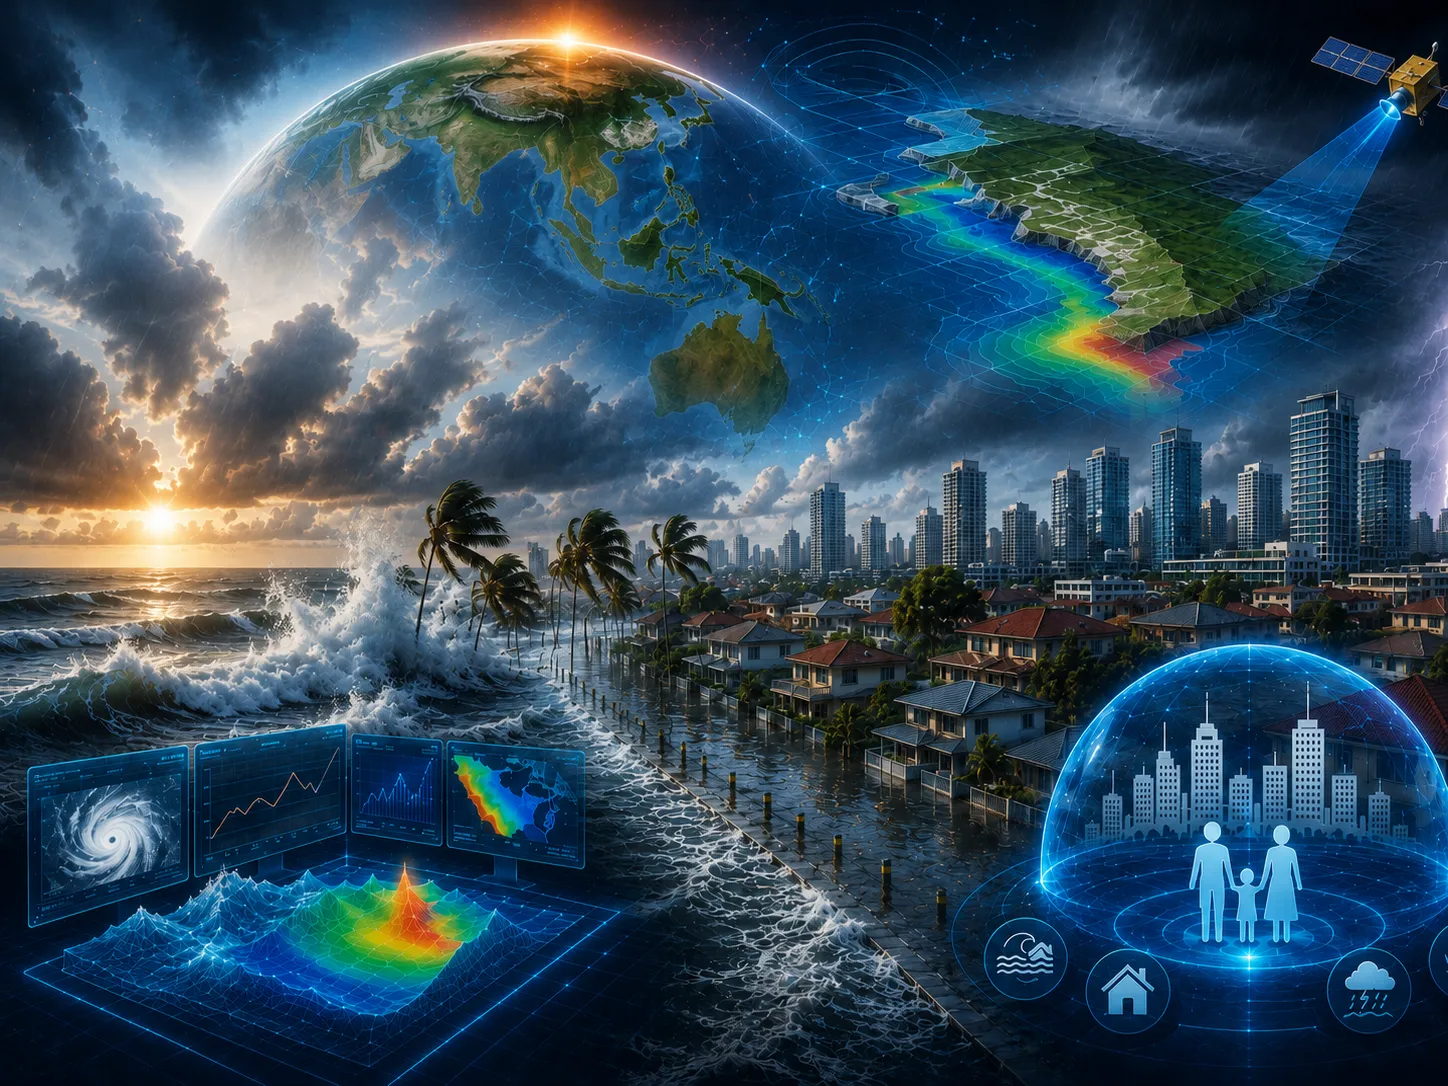
Comparison of existing conditions, alternatives, extremes, sensitivities, consequences, and mitigation options.
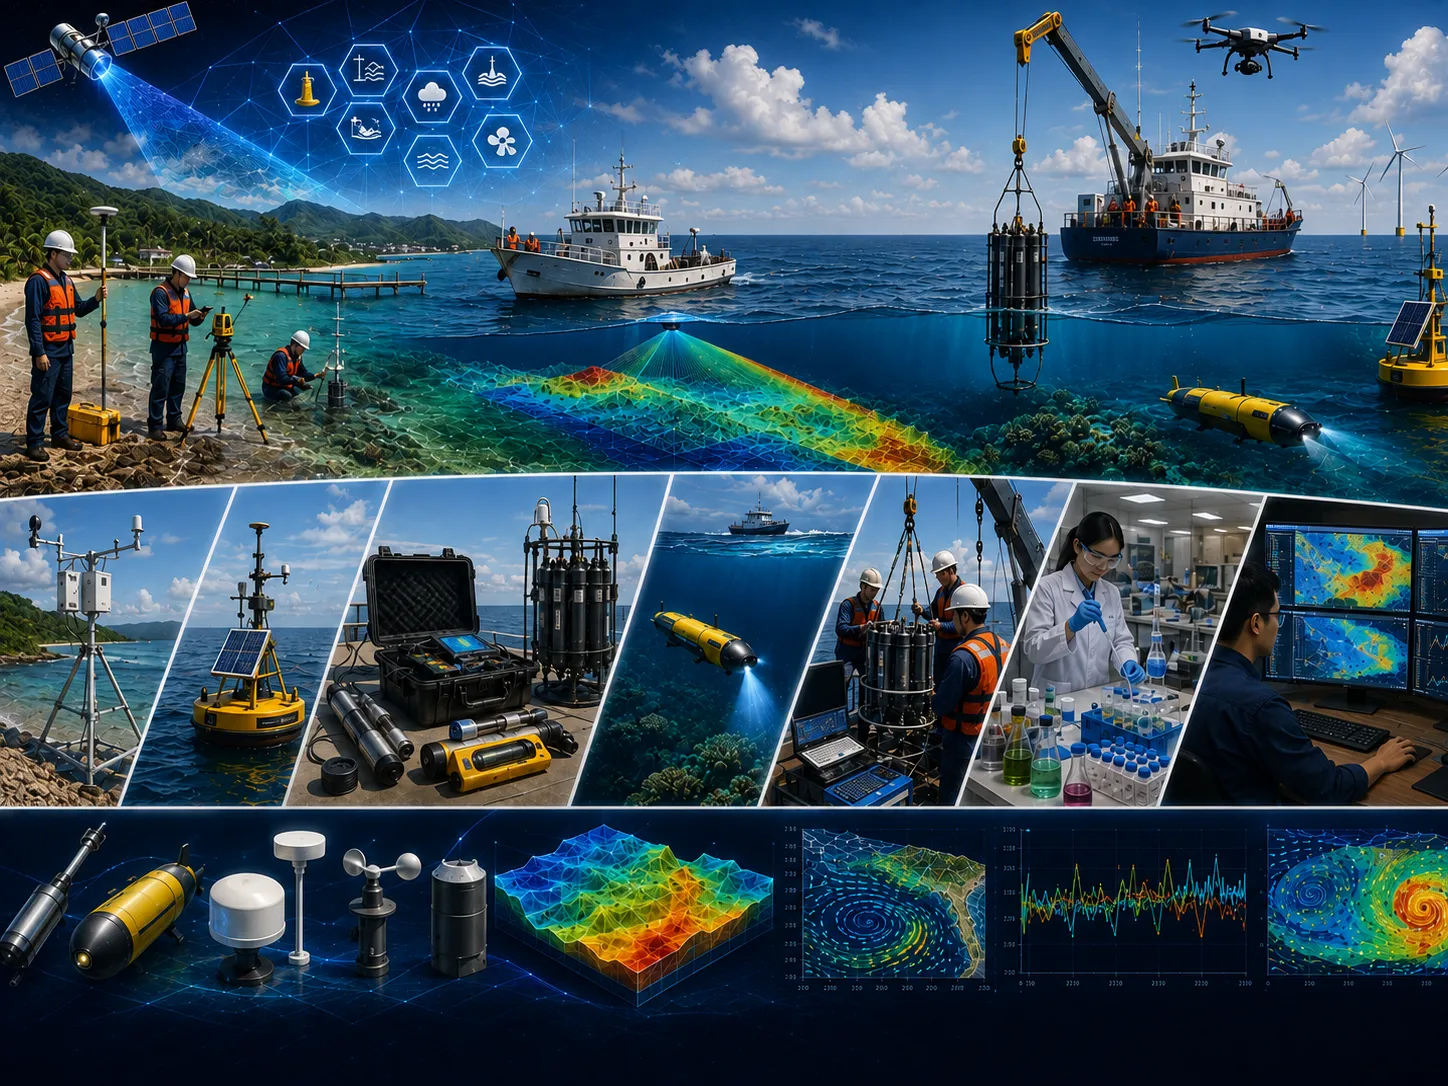
Methods, results, limitations, recommendations, action priorities, and stakeholder presentation materials.
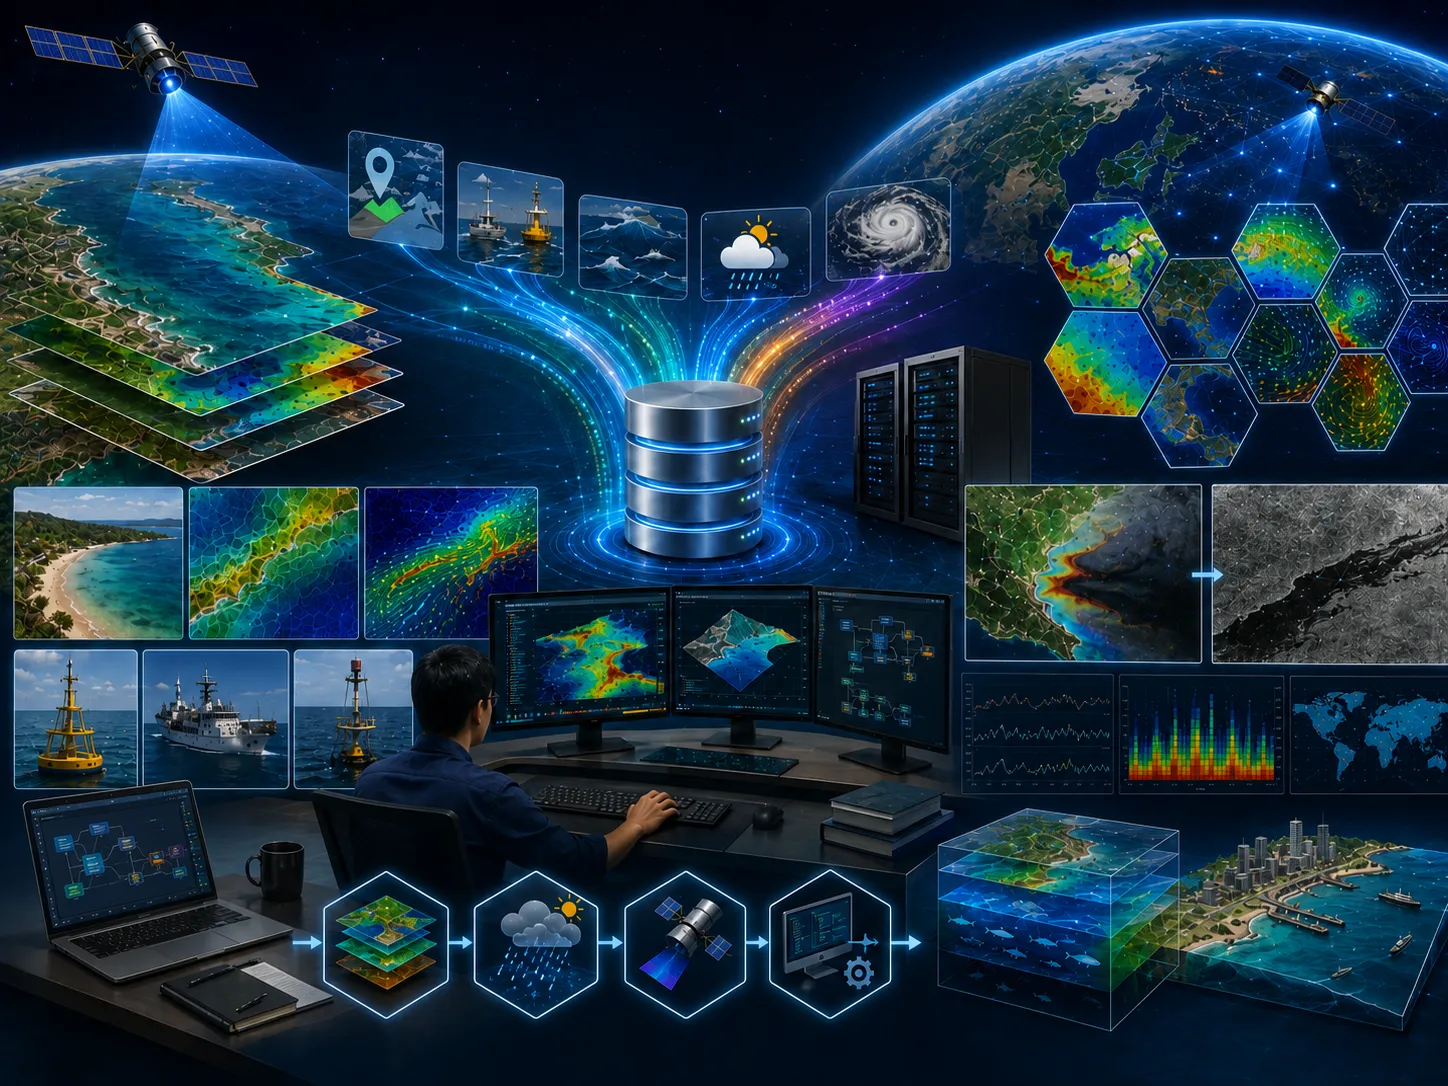
Assumptions, data, variability, and limitations are stated so decision risk is not hidden.
Alternative locations, designs, operations, or policies are assessed using consistent indicators.
Data needs and analysis depth are proportionate to risk so resources are used efficiently.
Findings and recommendations are transparent for technical, management, regulatory, and partner review.
Objectives, users, location, project phase, problems, constraints, and the decision to support.
Methods, data, surveys, models, schedule, team, deliverables, review gates, and resource estimate.
Collection, inspection, harmonization, documentation, and data-sufficiency assessment.
Processing, modeling, validation, option comparison, sensitivity, and risk evaluation.
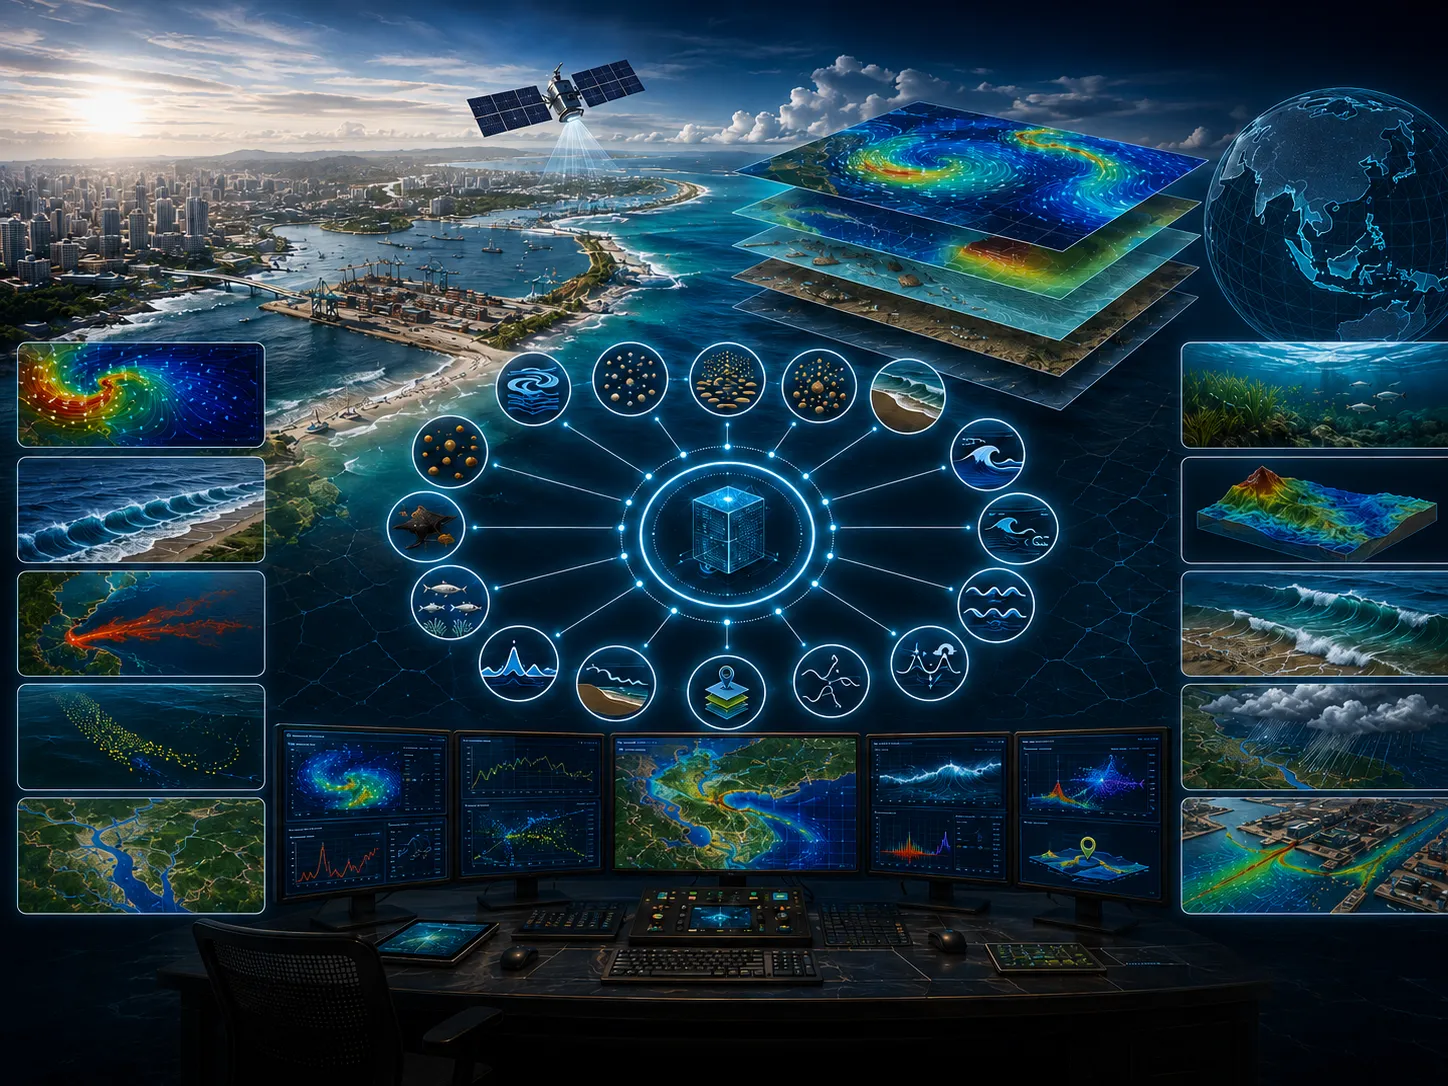
Maps, report, executive brief, presentation, supporting data, and follow-up plan.
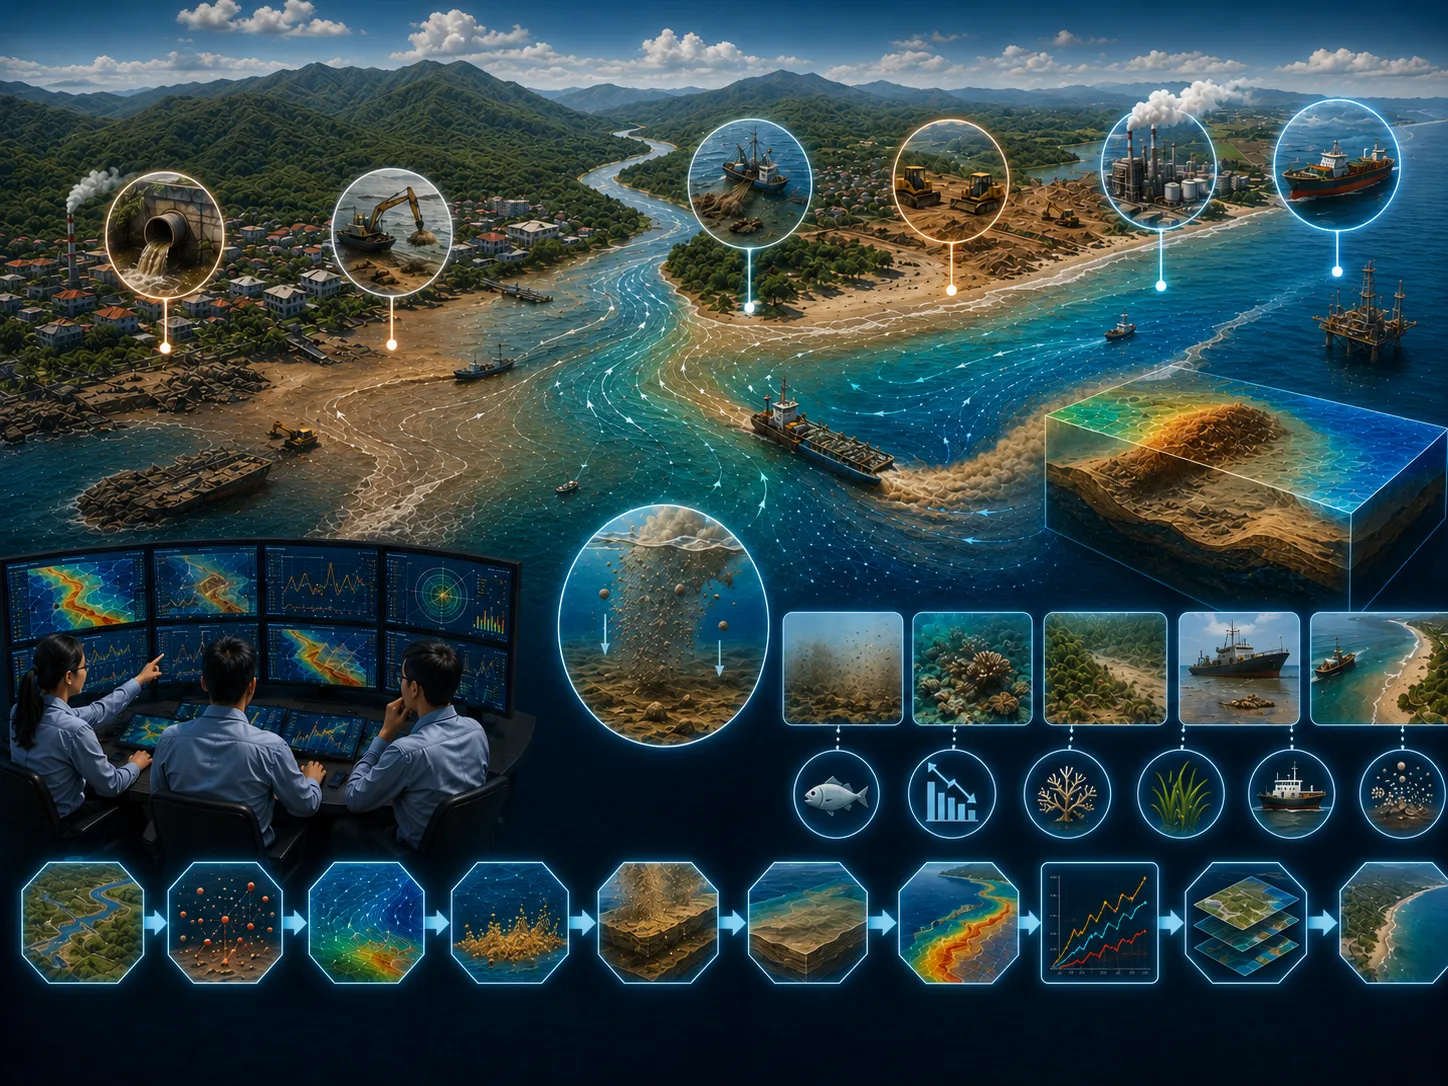
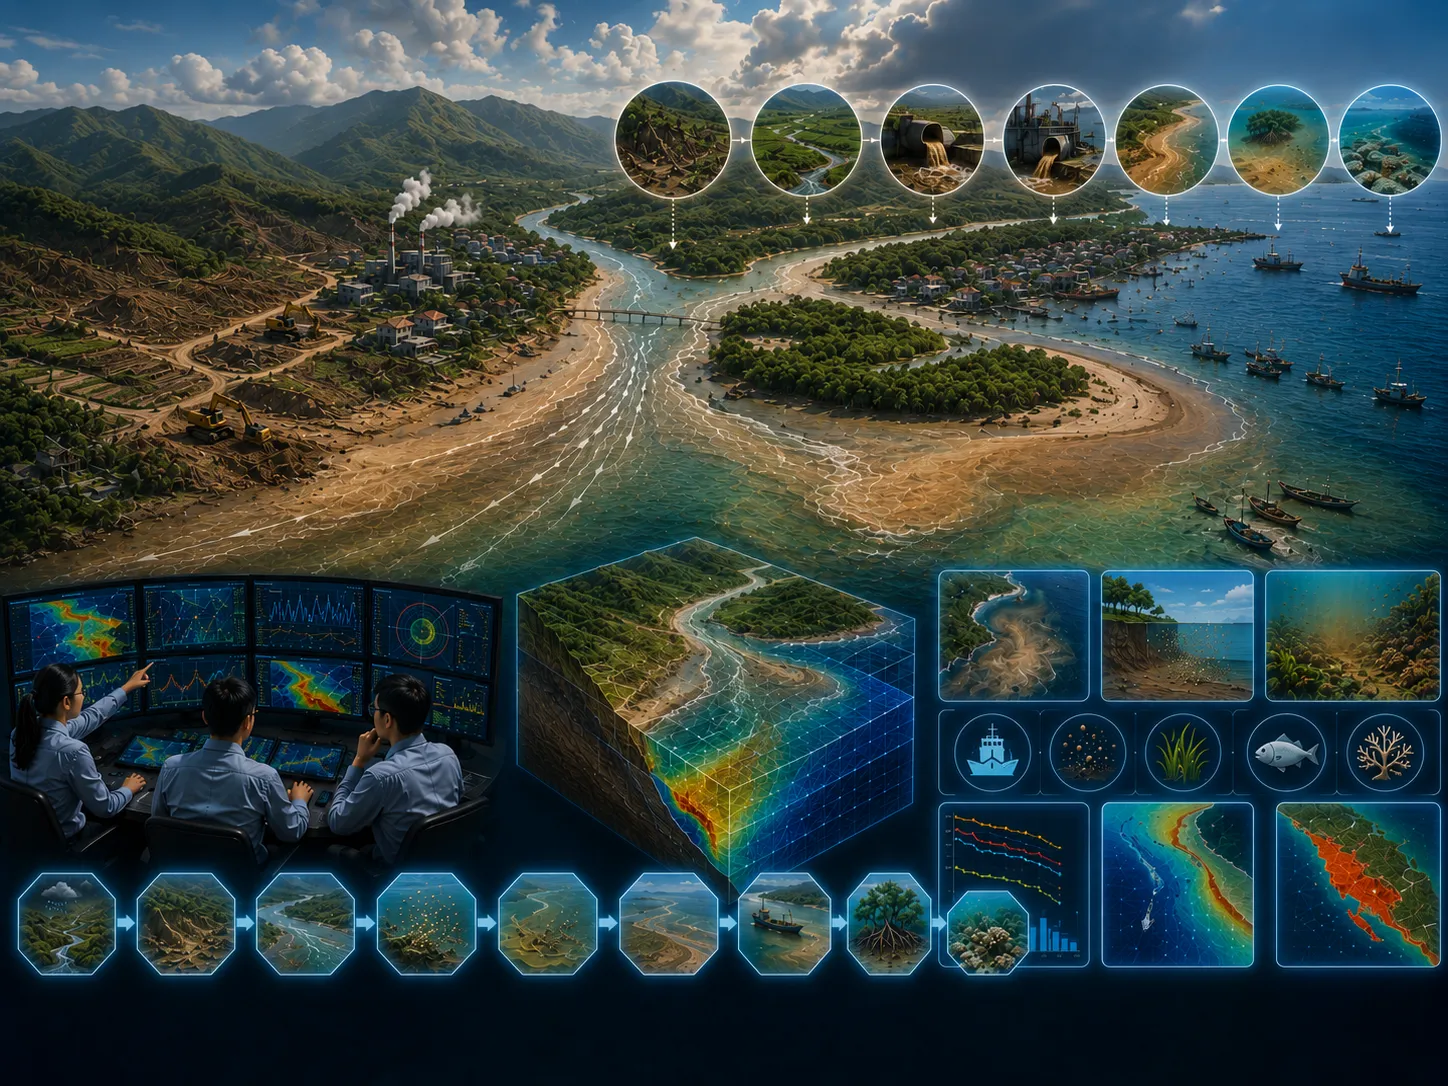
Sedimentation in aquatic environments resulting from human activities can have significant impacts on water quality, ecosystem health, and coastal sustainability. Major sources of anthropogenic sediment include domestic wastewater discharges, dredging operations, bottom trawling, coastal land clearing, industrial effluent, coastal and offshore construction, agricultural land development near the coastline, shipping activities, and sediment transported by rivers due to human activities throughout the watershed. Excessive sedimentation can cause numerous adverse environmental and economic impacts, including mortality of marine organisms, loss of biodiversity, navigation hazards caused by channel shoaling, degradation or loss of critical habitats, declines in natural seafood resources, changes in sediment grain-size distribution, increased water turbidity, and alterations to seabed bathymetry.
These adverse impacts can be significantly reduced through the application of advanced numerical modeling. Modeling technologies provide a scientific framework for identifying sediment sources associated with human activities and evaluating their relative contributions to sediment loading in coastal waters. Simulations of sediment transport and hydrodynamic circulation enable the identification of sediment pathways, deposition zones, and areas vulnerable to excessive sediment accumulation. Numerical models can also evaluate multiple sediment discharge scenarios by simulating the transport and fate of sediments entering aquatic environments under varying environmental conditions. These scenario-based assessments provide decision-makers with valuable information regarding the potential environmental consequences of future developments. Modeling scenarios are typically developed according to the magnitude, frequency, and intensity of human activities that generate sediments as point-source inputs.
Typical applications of numerical modeling for sedimentation studies include: (1) River Sedimentation. (2) Seabed Dredging Sedimentation. (3) Sediment Waste Disposal Sedimentation. (4) Coastal Erosion Sedimentation. (5) Surface Runoff Sedimentation.
Coastal flooding has become an increasingly significant challenge as rising sea levels associated with global climate change continue to affect coastal regions worldwide.
Learn more →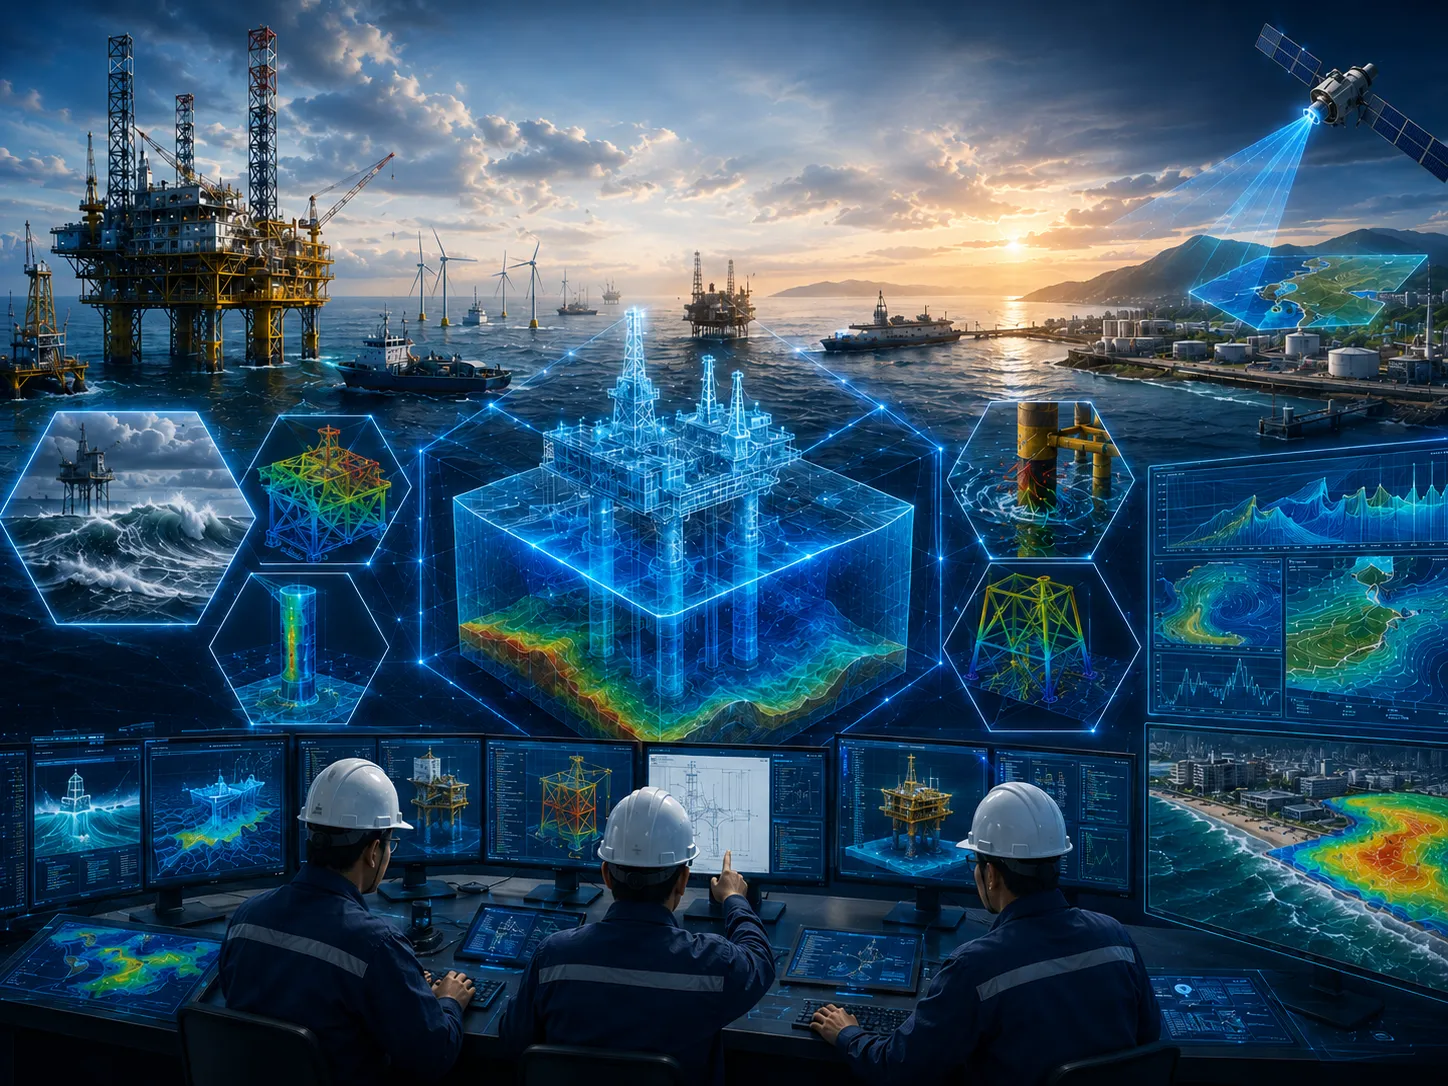
The coastal and offshore industry is experiencing rapid growth and is expected to continue expanding as advances in marine technology enable more effective utilization of ocean resources.
Learn more →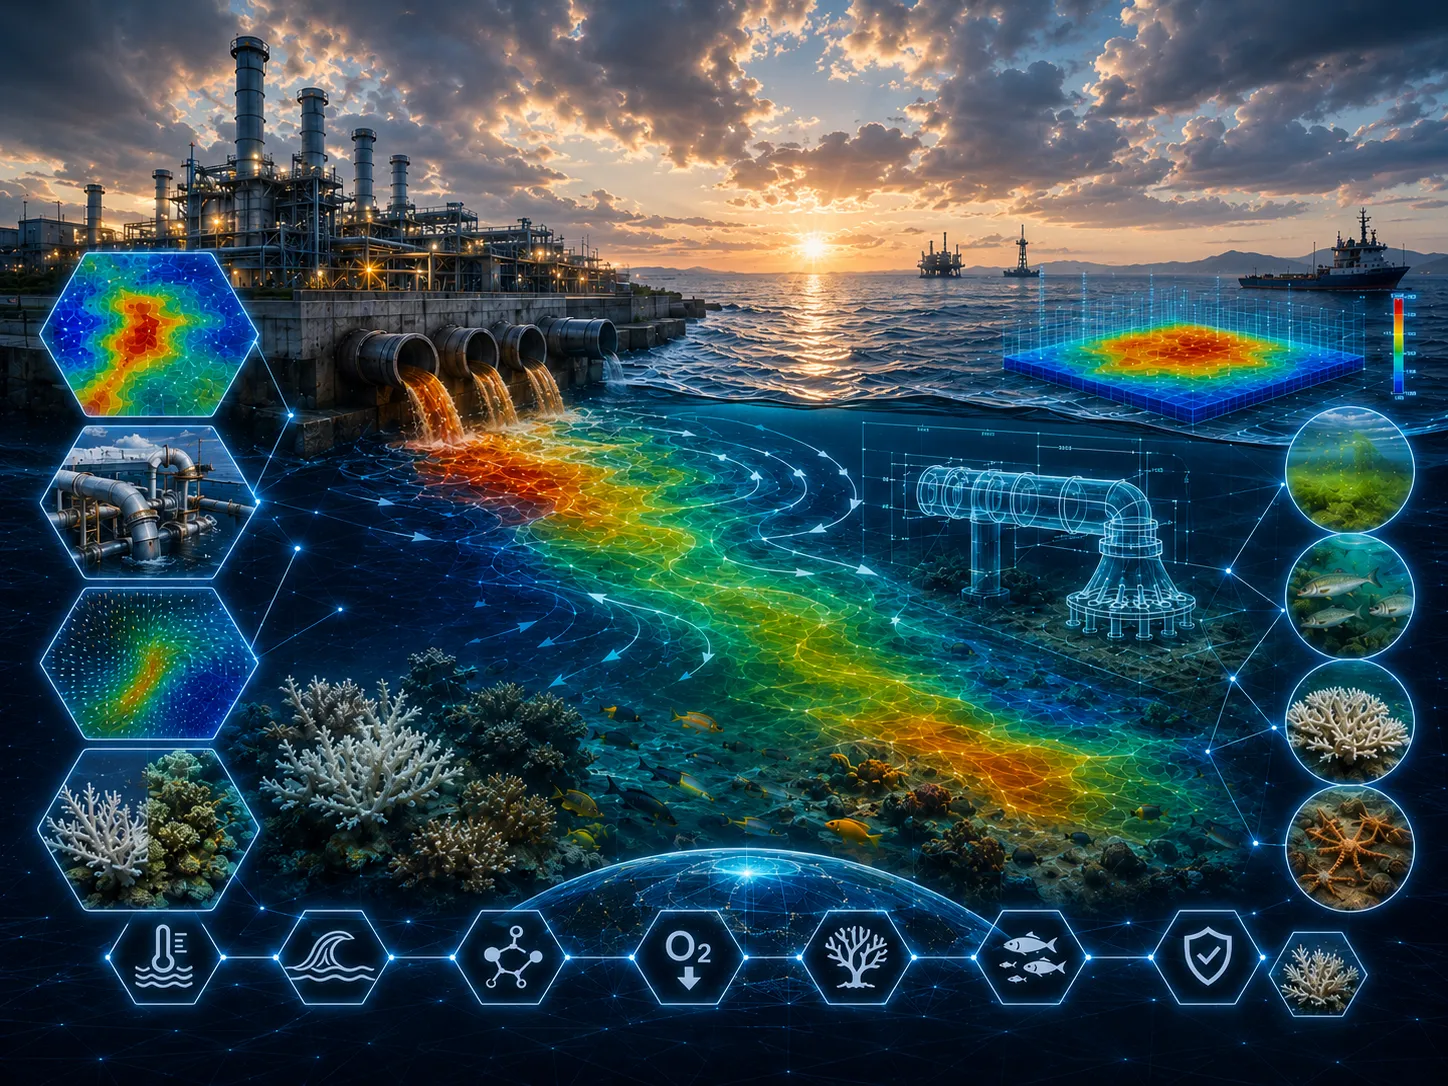
Changes in seawater temperature can significantly affect photosynthesis, aerobic respiration, growth, reproduction, metabolism, and survival of marine organisms.
Learn more →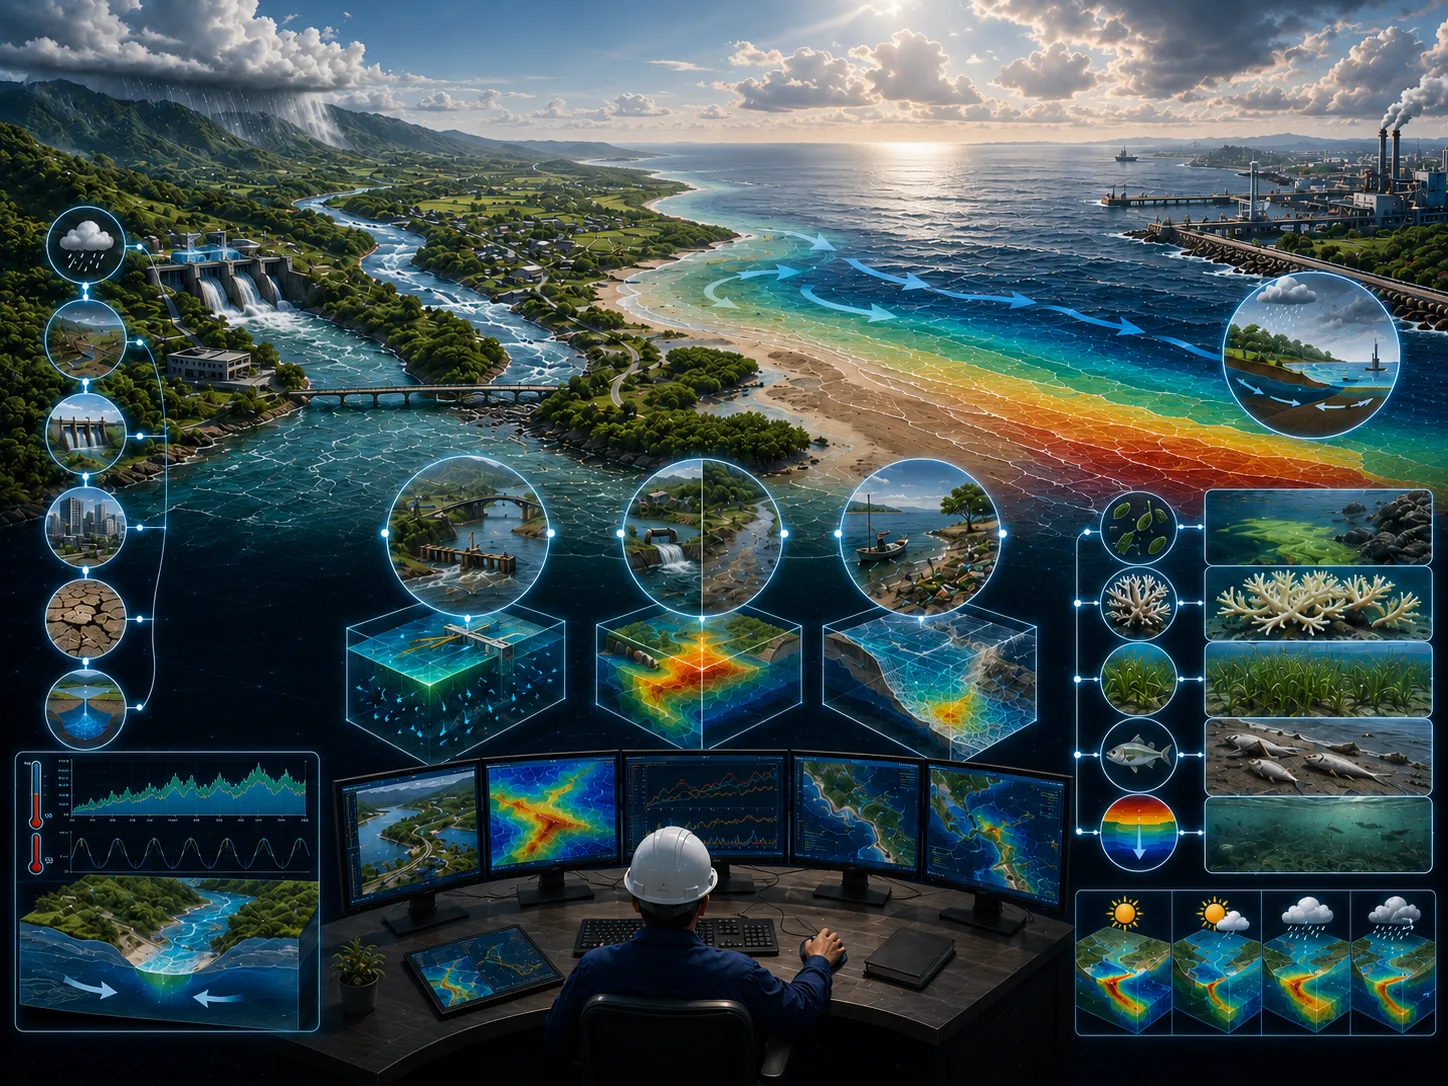
Changes in freshwater inflow from rivers and surface runoff play a critical role in controlling environmental conditions within estuaries and adjacent coastal waters.
Learn more →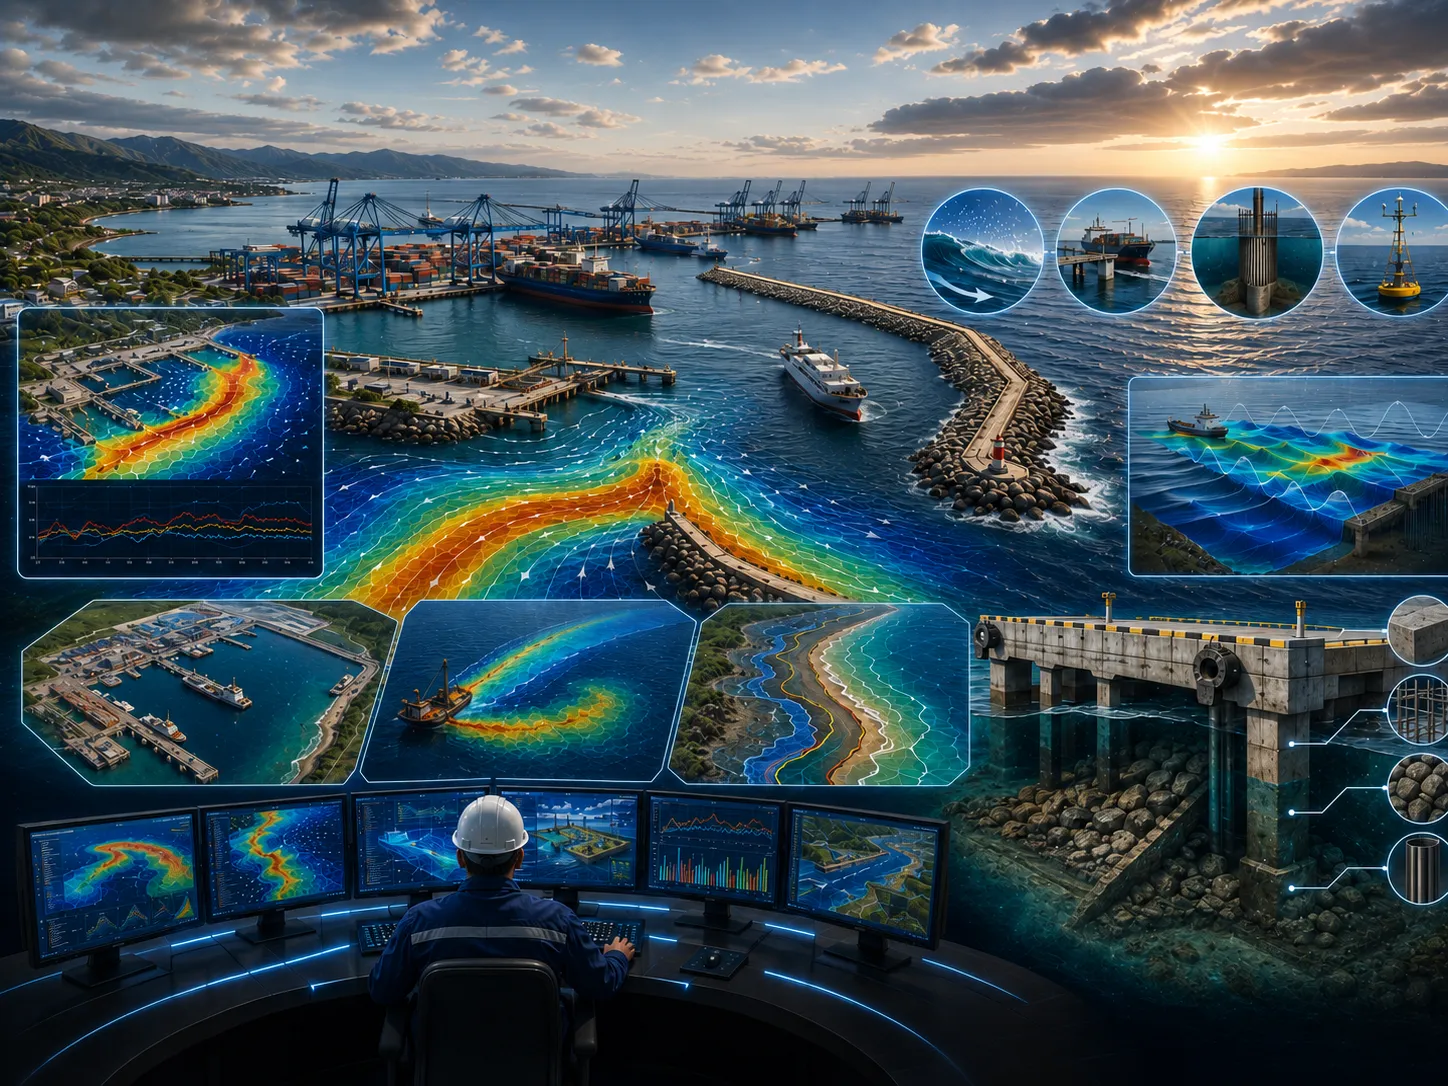
Planning and designing modern port infrastructure is a highly complex engineering process.
Learn more →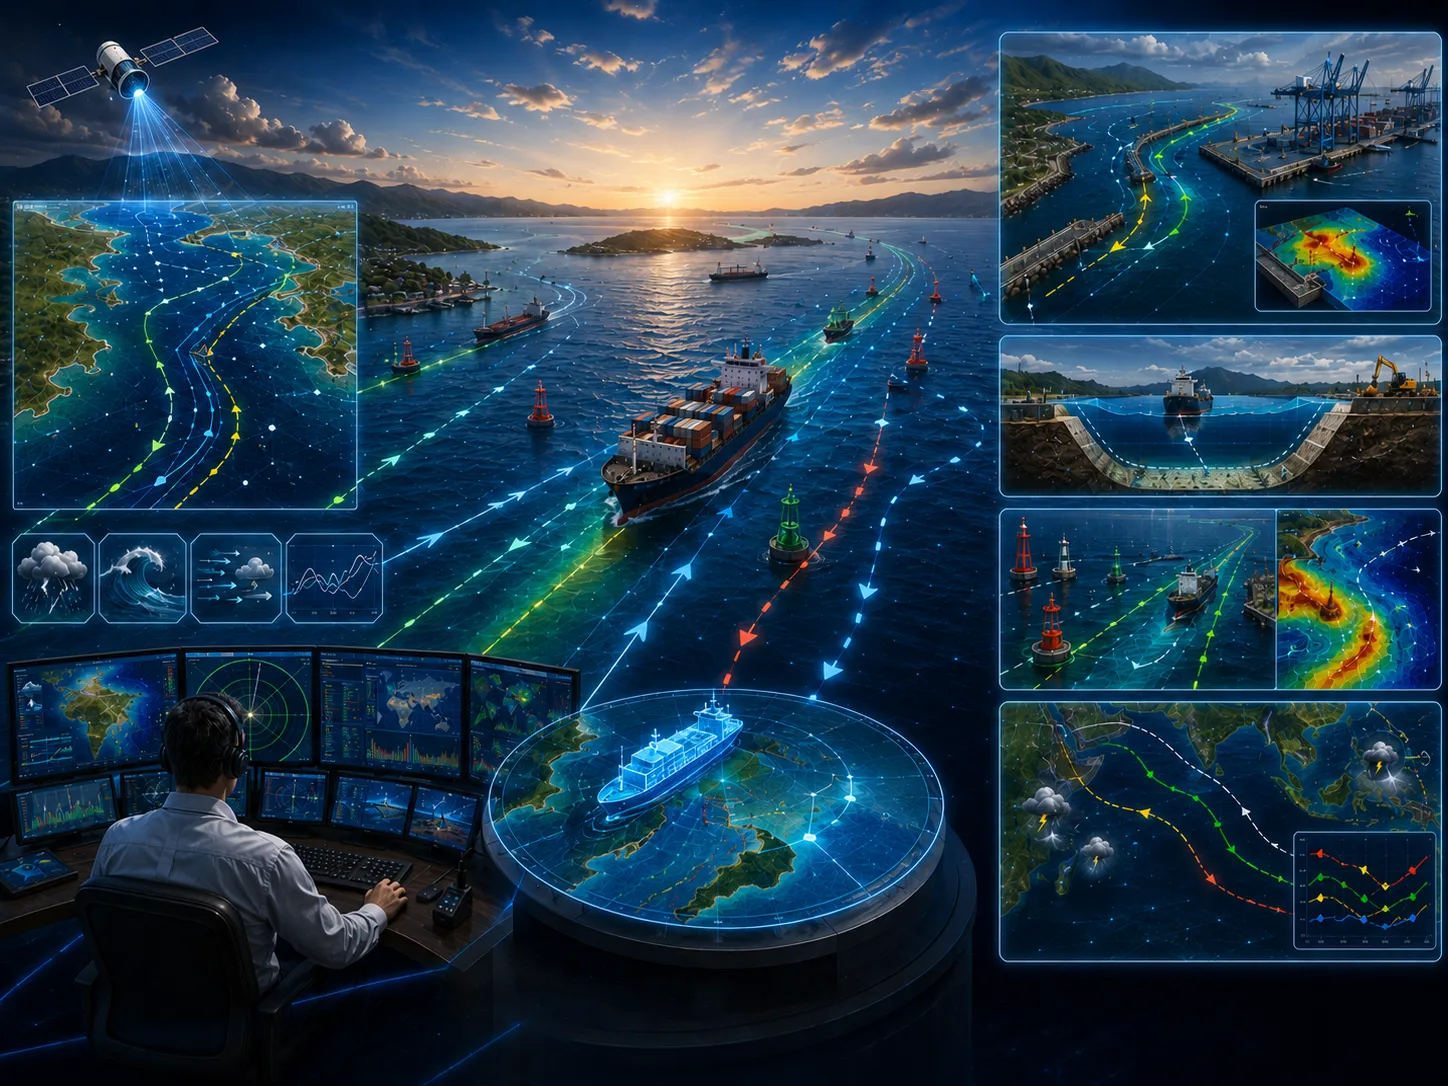
Planning shipping routes for vessels traveling between ports and across different marine regions is a critical process that requires careful evaluation.
Learn more →The CORZ team will review the objective, scope, data availability, risk level, schedule, and required outputs to prepare a proportionate approach.
Share the location, objectives, key challenges, available data, and expected outputs. The CORZ team will help define a proportionate technical approach.