CONTEXTField conditions and systems being assessed
Enter at least two characters.
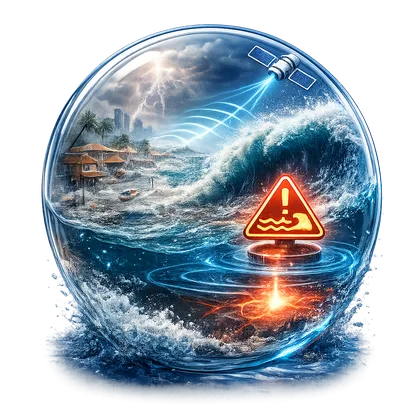
Wave, tide, and tsunami flooding can occur due to rising sea levels during extreme high tides, the propagation of long waves from distant sources, and tsunami events.
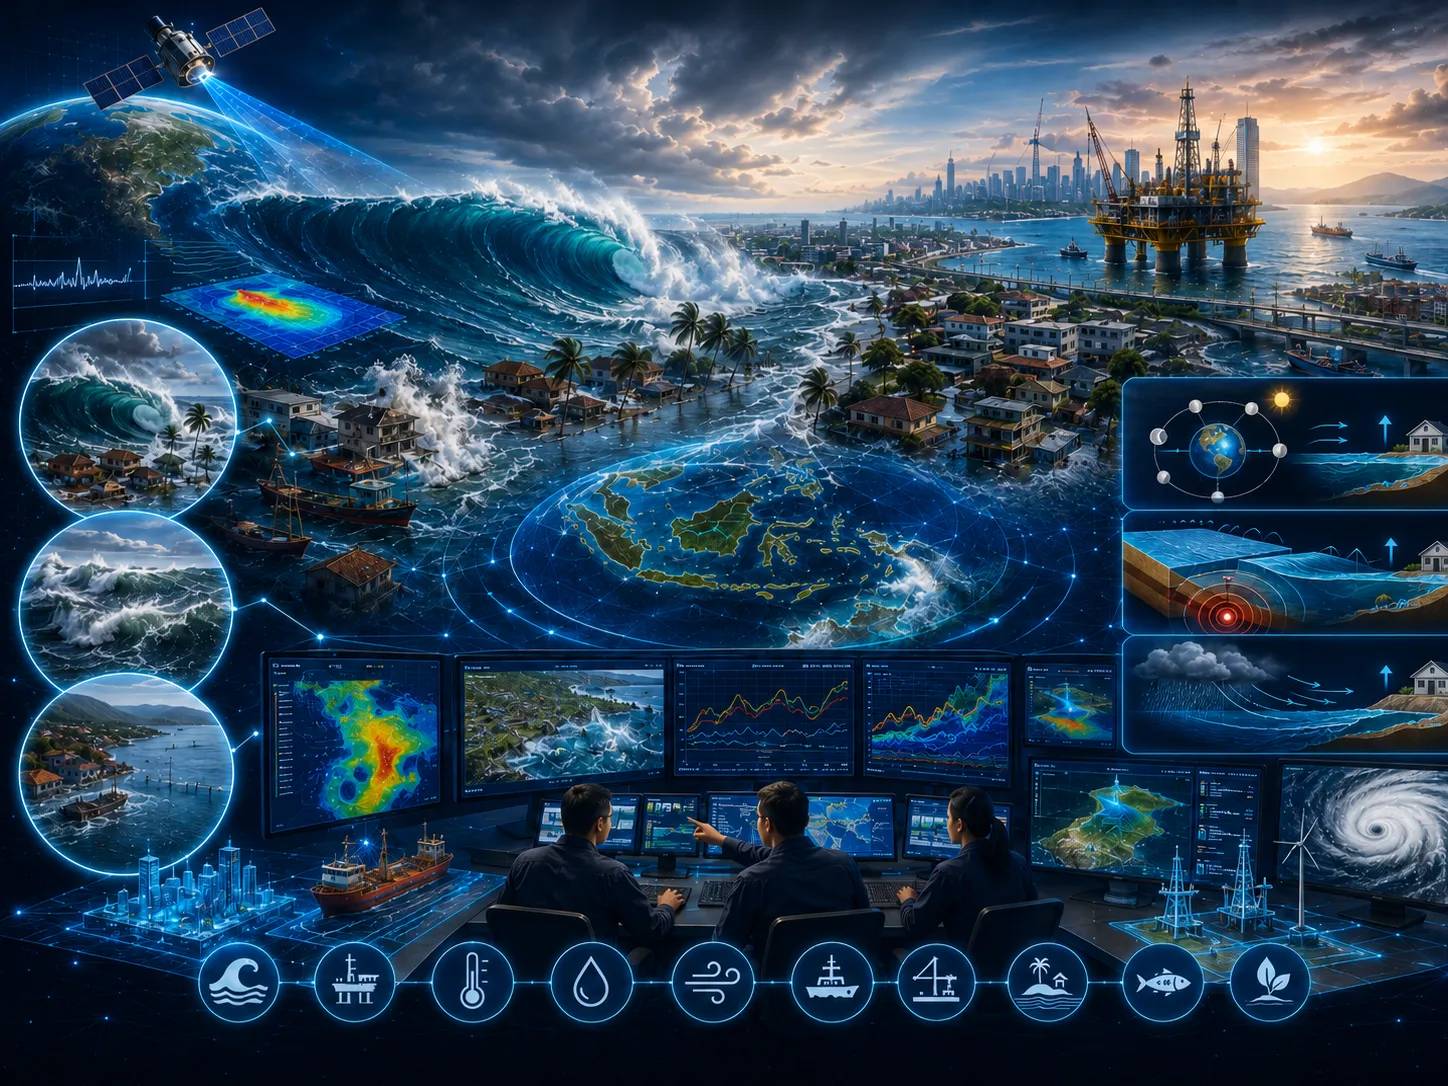
This page includes a one-page leaflet that can be opened in a full-image popup. It helps present the core CORZ service clearly and convincingly during project discussions, executive briefings, and decision-support meetings.
With a more proportional balance between visuals and text, the page feels brighter and more energetic while still keeping the important technical context visible and easy to understand.
Use this leaflet as a concise visual entry point before moving into the more detailed technical explanation.
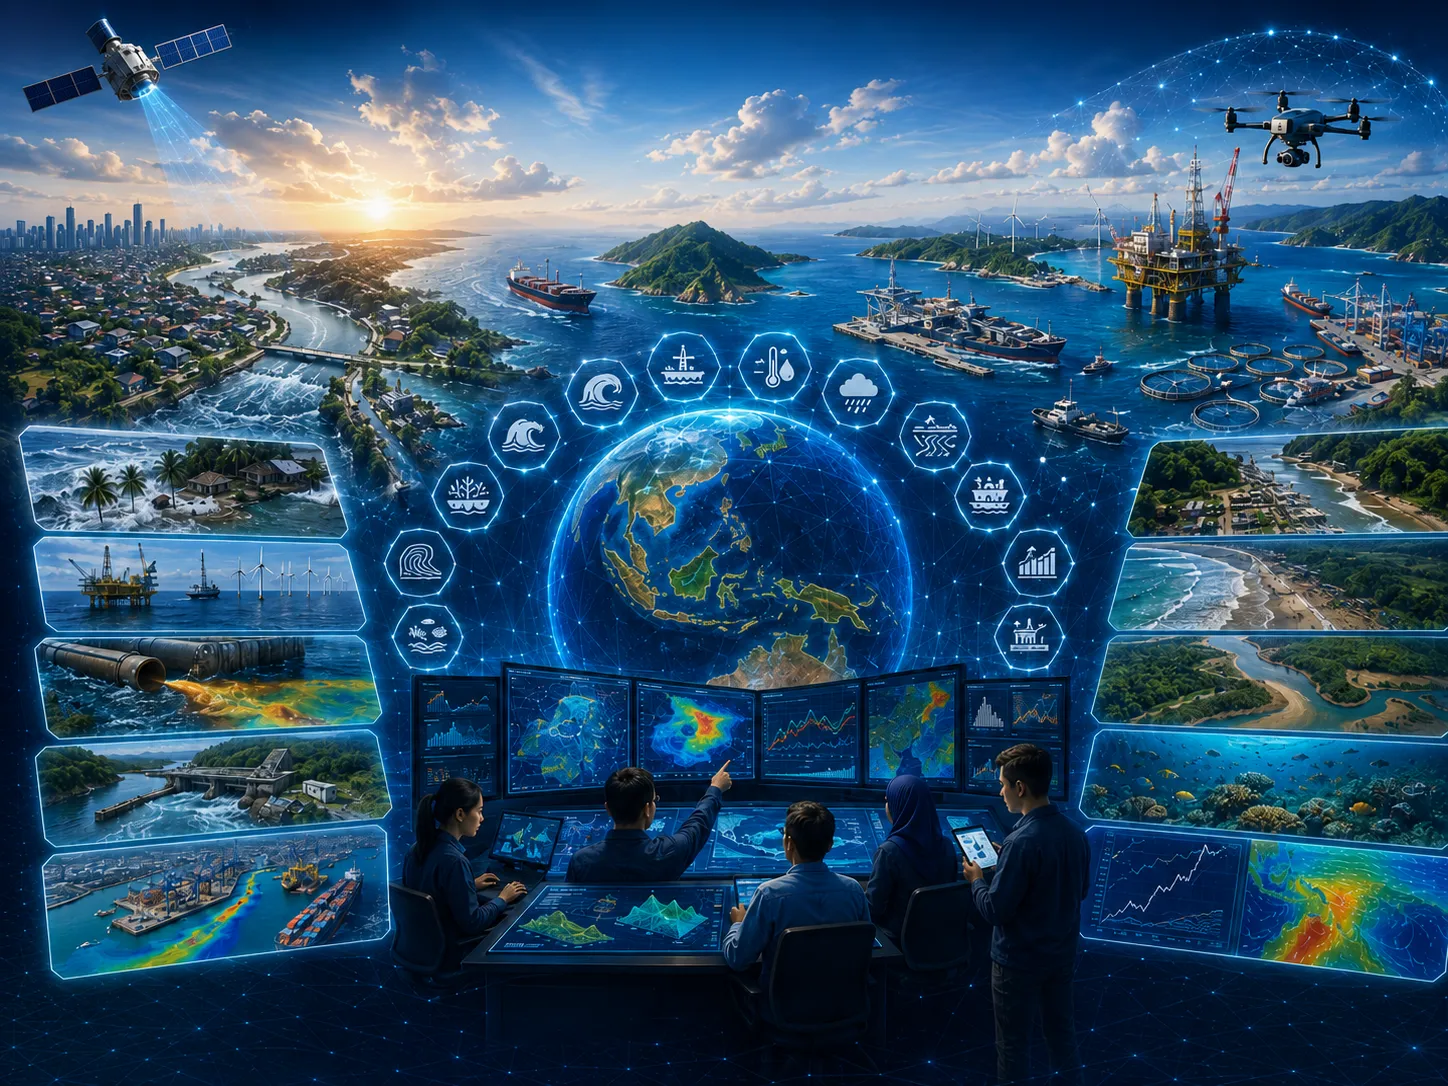
Clarity before a decision is made
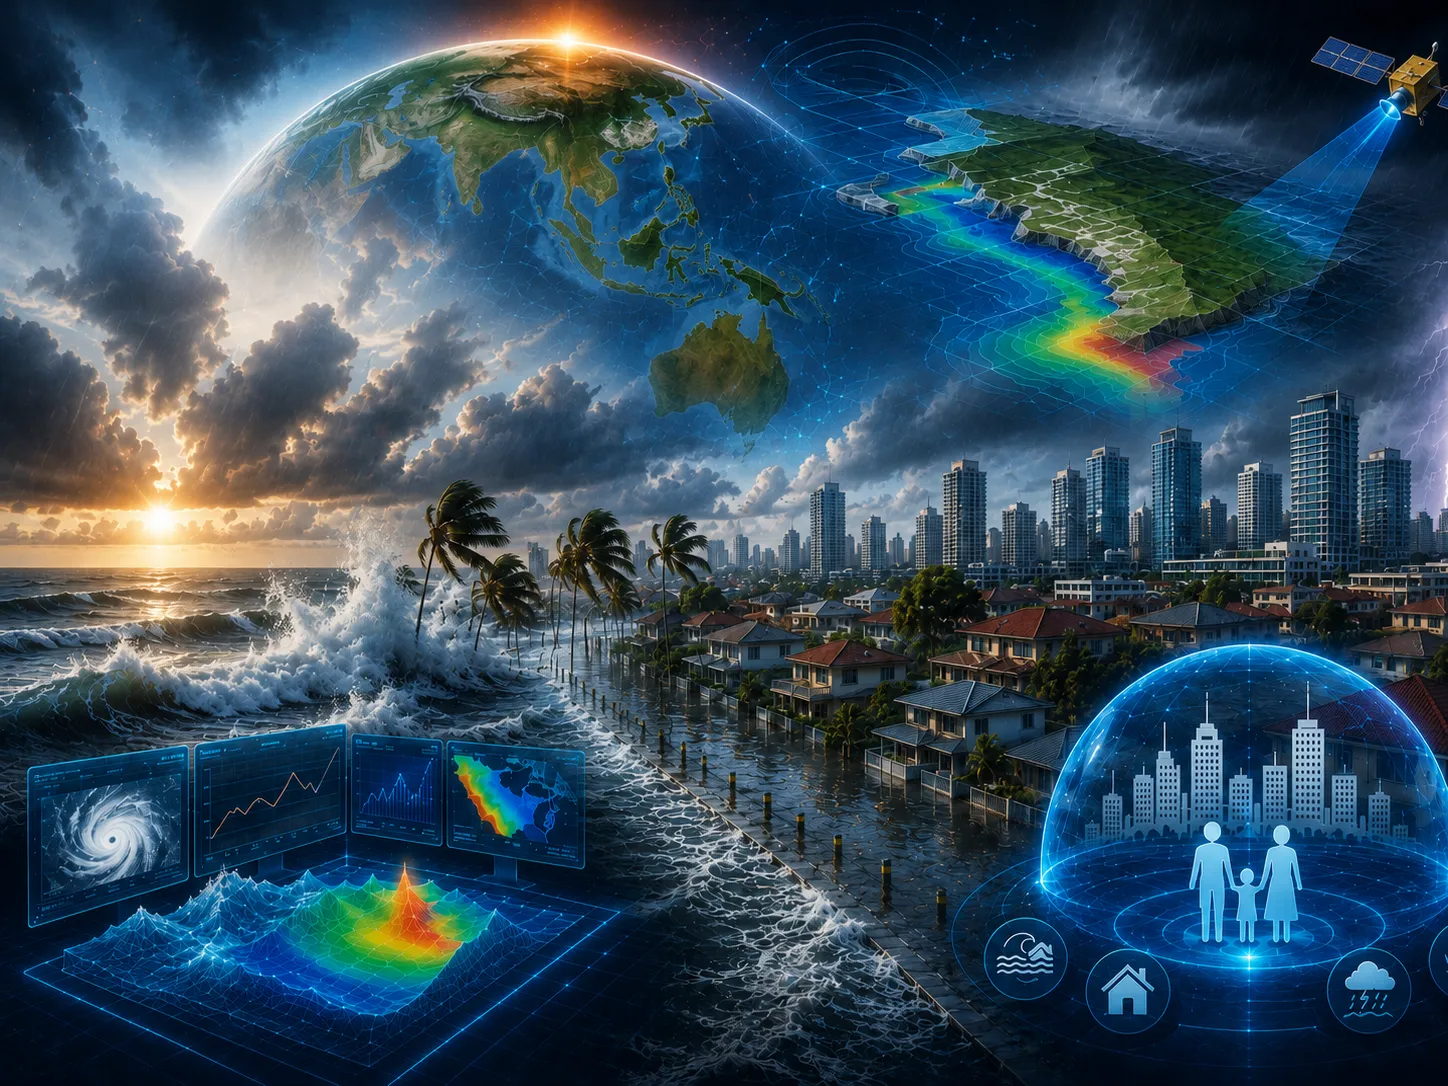
Wave, tide, and tsunami flooding can occur due to rising sea levels during extreme high tides, the propagation of long waves from distant sources, and tsunami events.
Long waves generated from distant sources, such as Kelvin waves, Rossby waves, and internal solitary waves, may also cause flooding in low-lying and gently sloping coastal areas. In some cases, internal solitary waves can create more significant impacts due to their high wave energy.
Define the approach, priorities, and actions for wave, tide, and tsunami flooding using traceable evidence.
Environmental impact, design failure, operational disruption, uncontrolled cost, and weak assumptions.
Comparable options, quantified risk, and implementable recommendations.
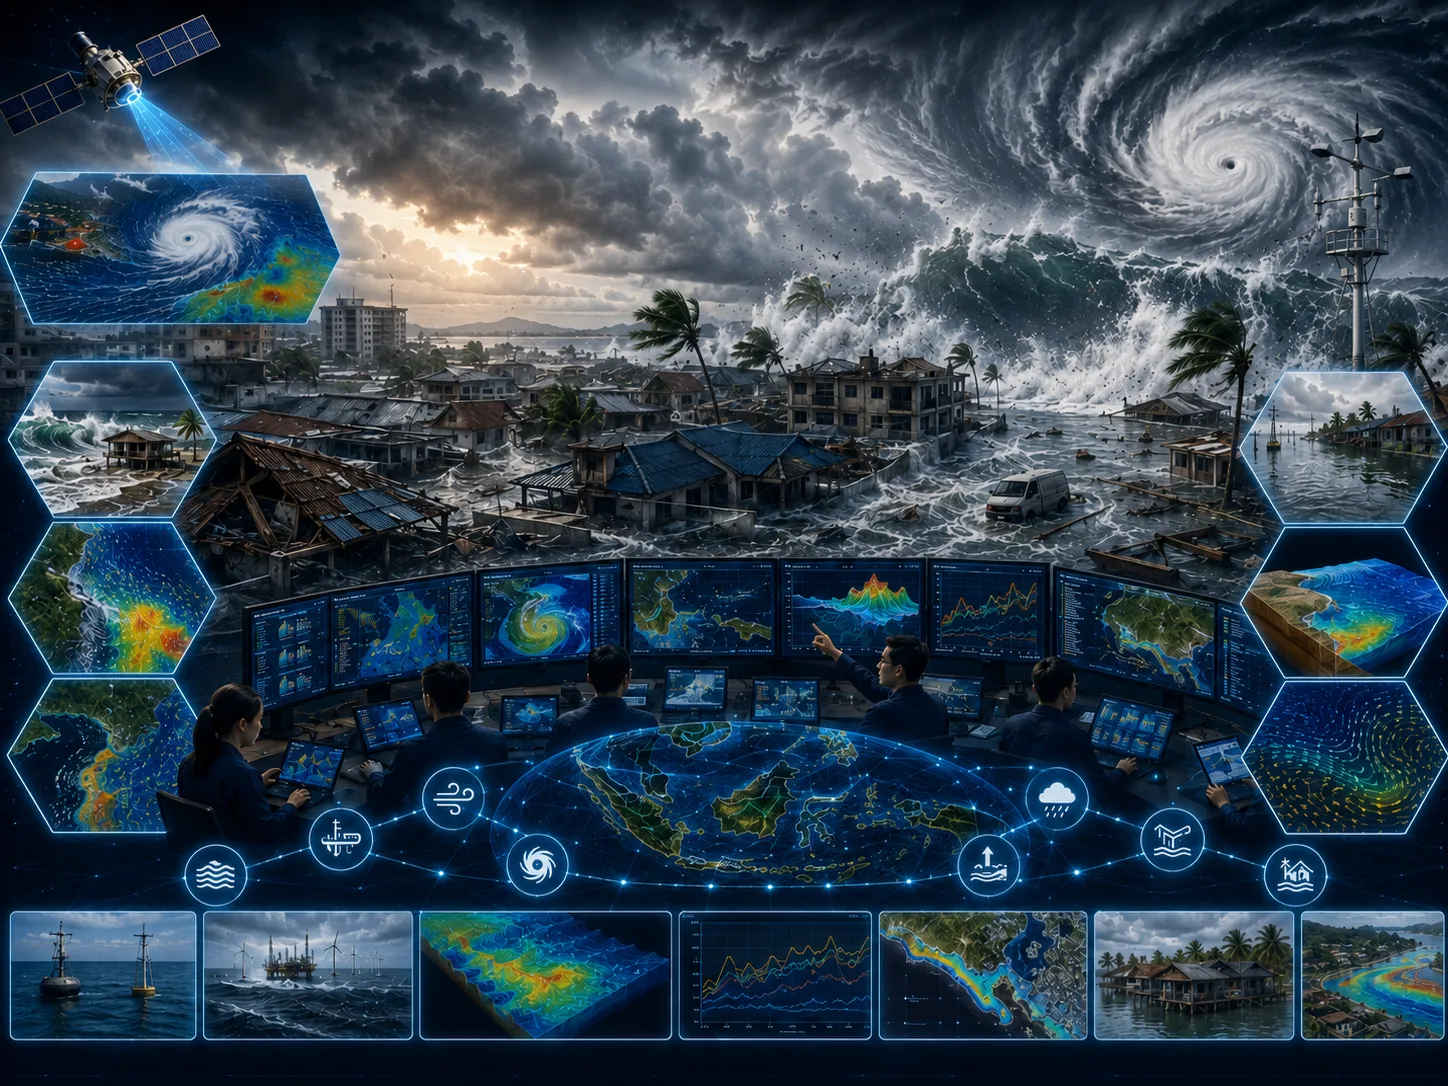
This aspect is assessed to clarify its implications for wave, tide, and tsunami flooding.
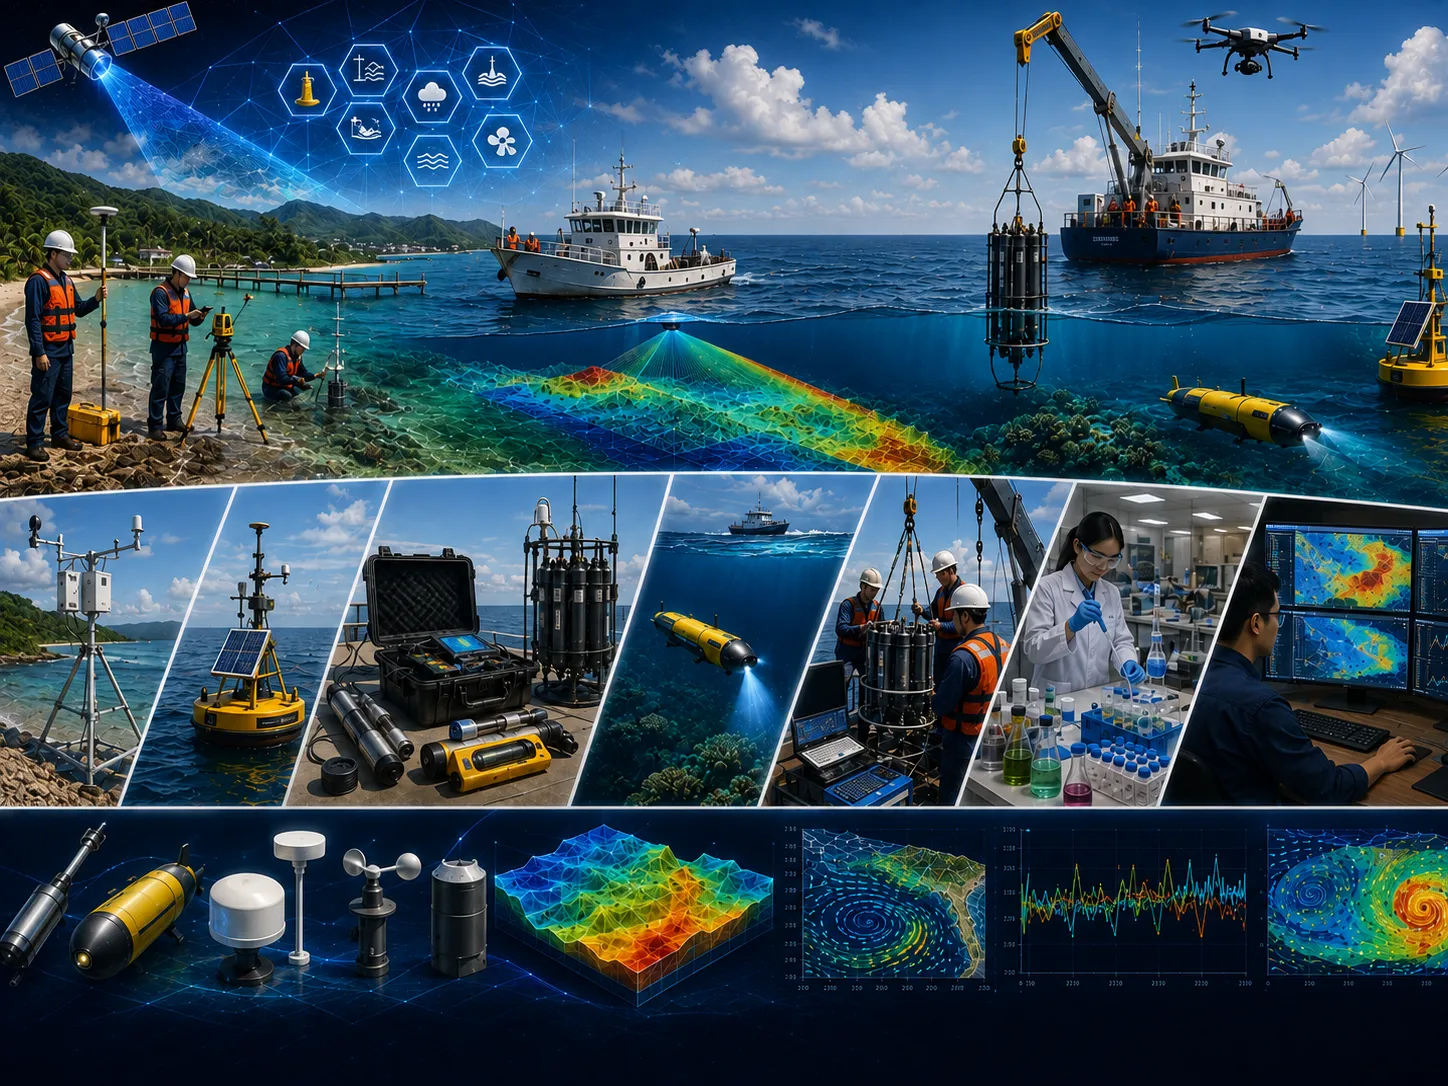
This aspect is assessed to clarify its implications for wave, tide, and tsunami flooding.
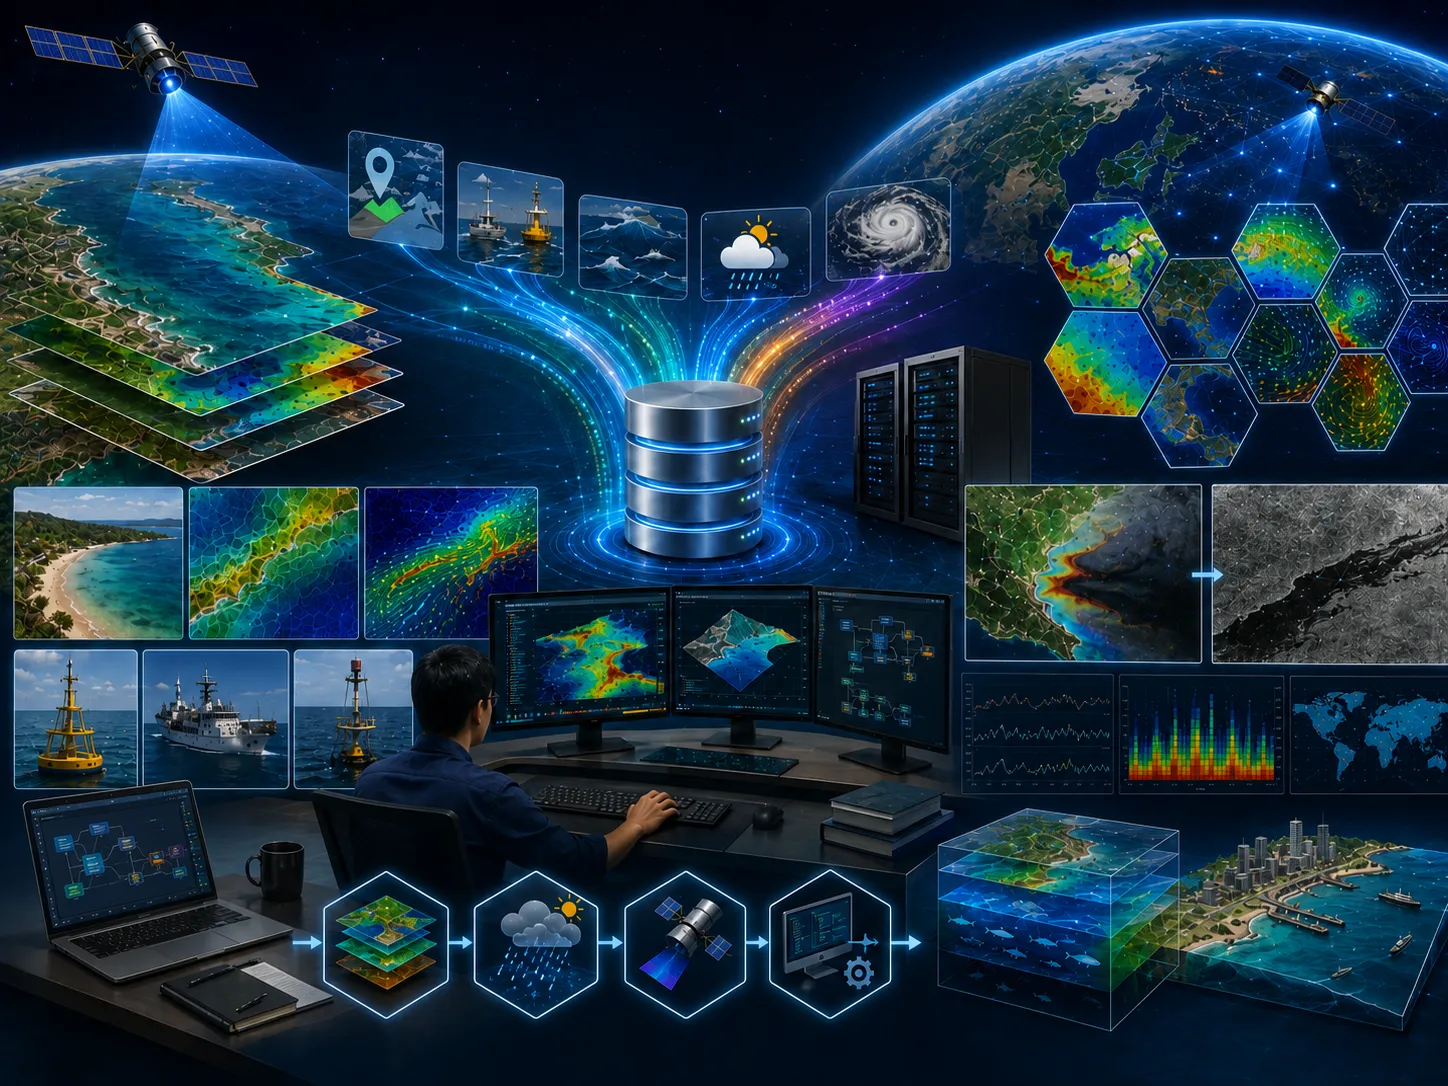
This aspect is assessed to clarify its implications for wave, tide, and tsunami flooding.

This aspect is assessed to clarify its implications for wave, tide, and tsunami flooding.
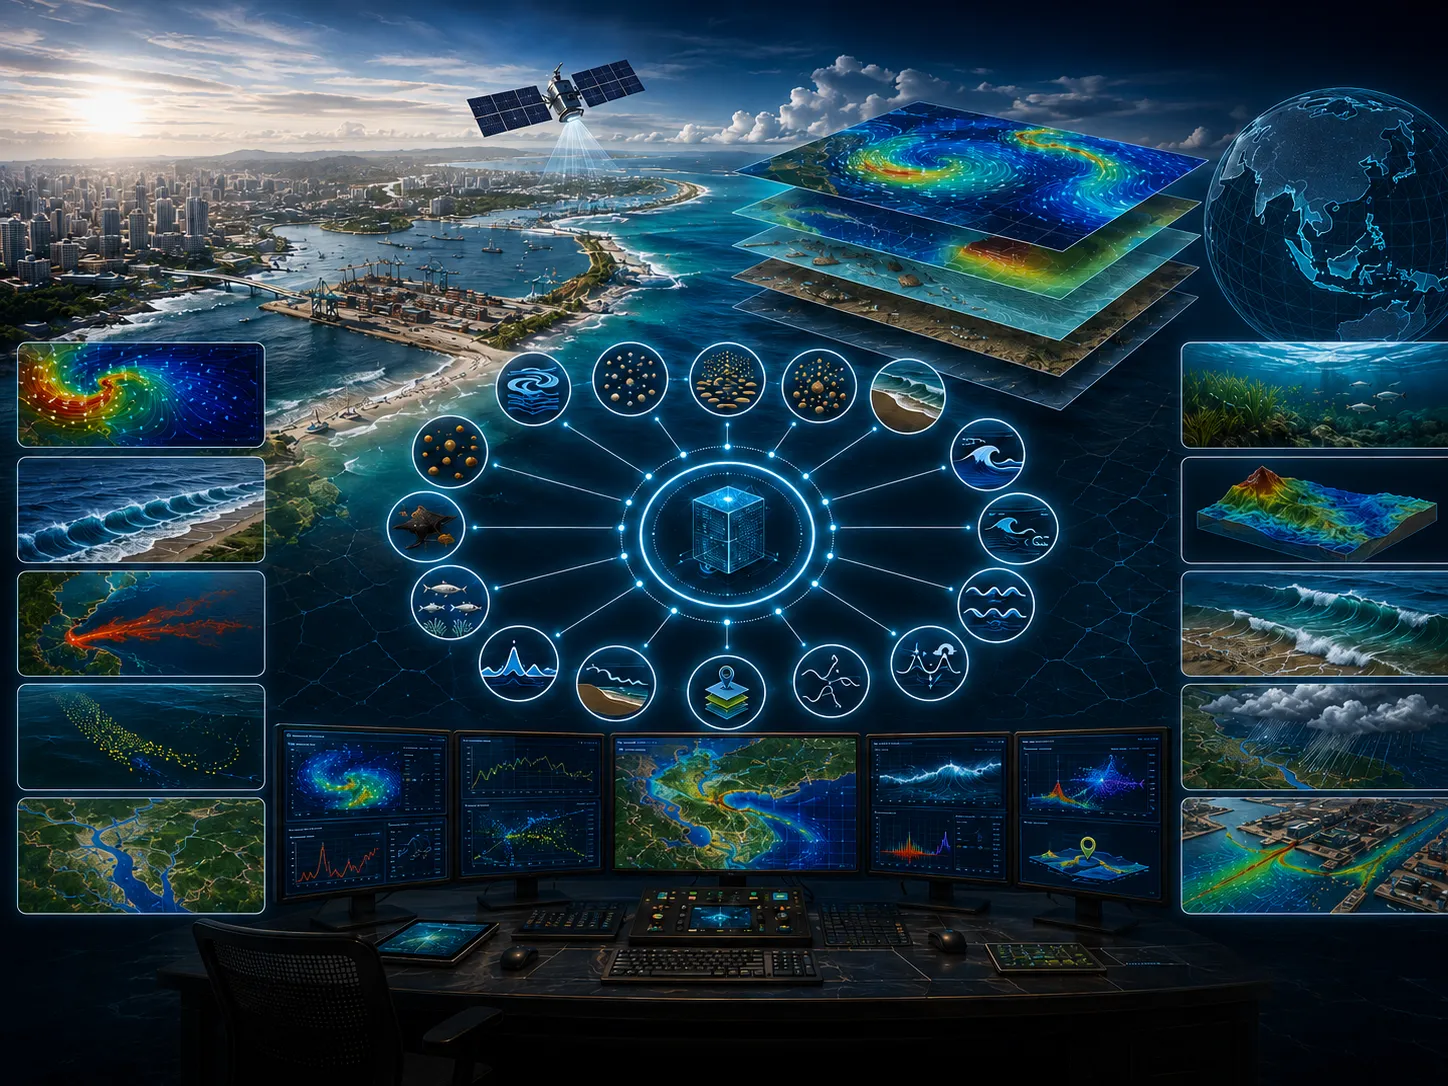
This aspect is assessed to clarify its implications for wave, tide, and tsunami flooding.
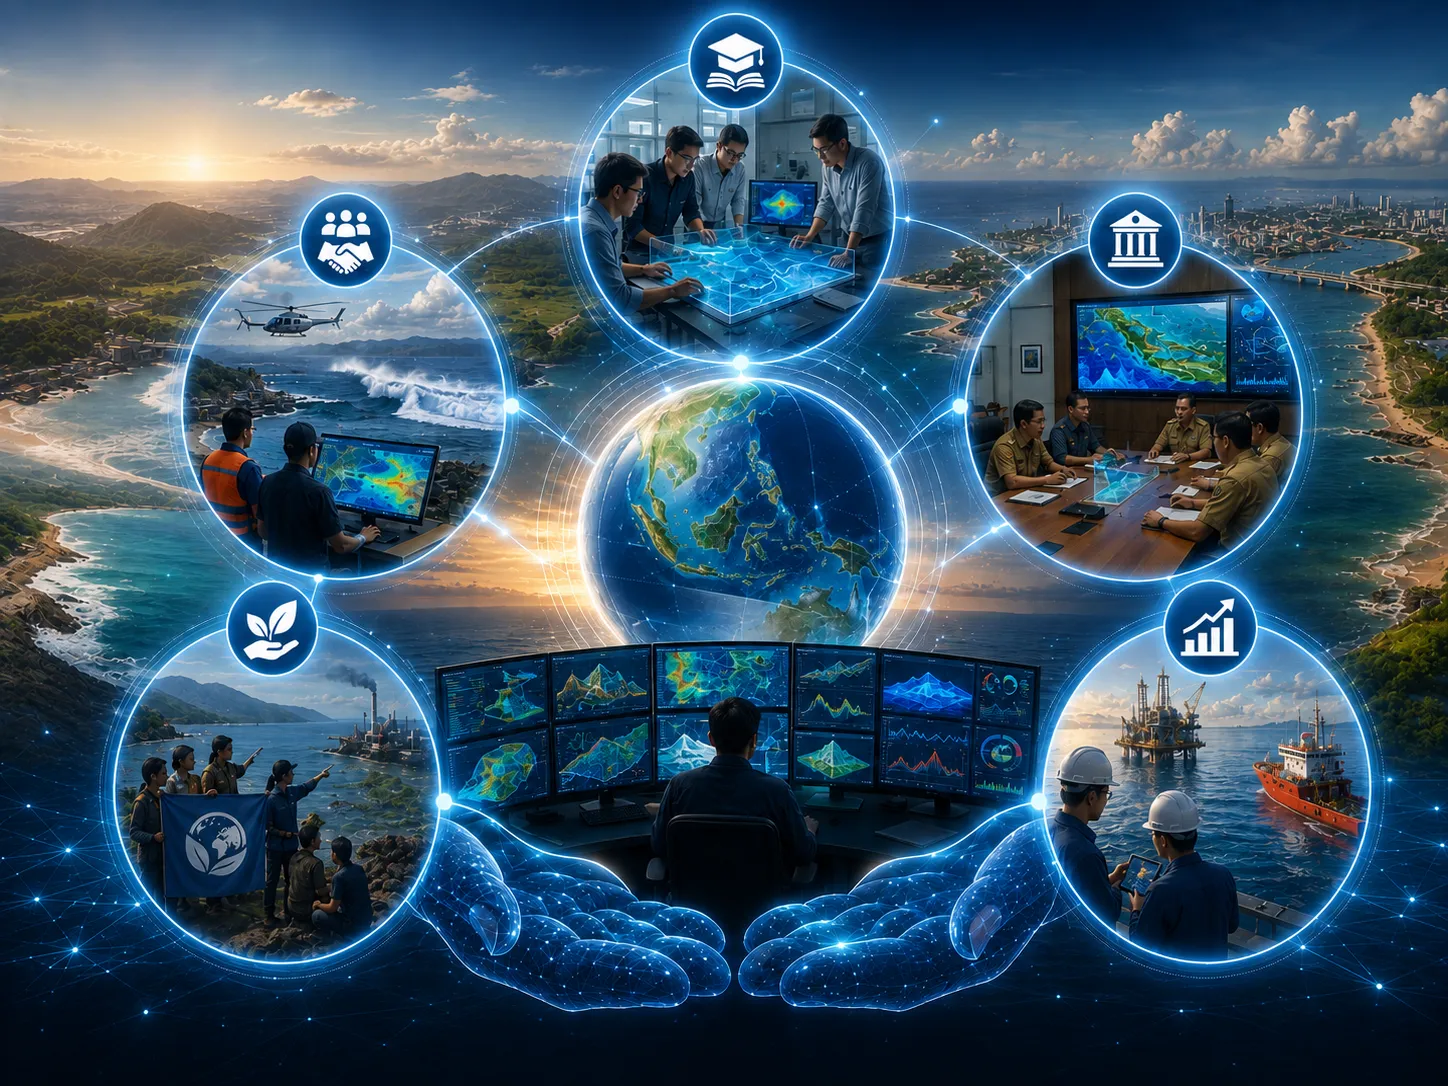
This aspect is assessed to clarify its implications for wave, tide, and tsunami flooding.
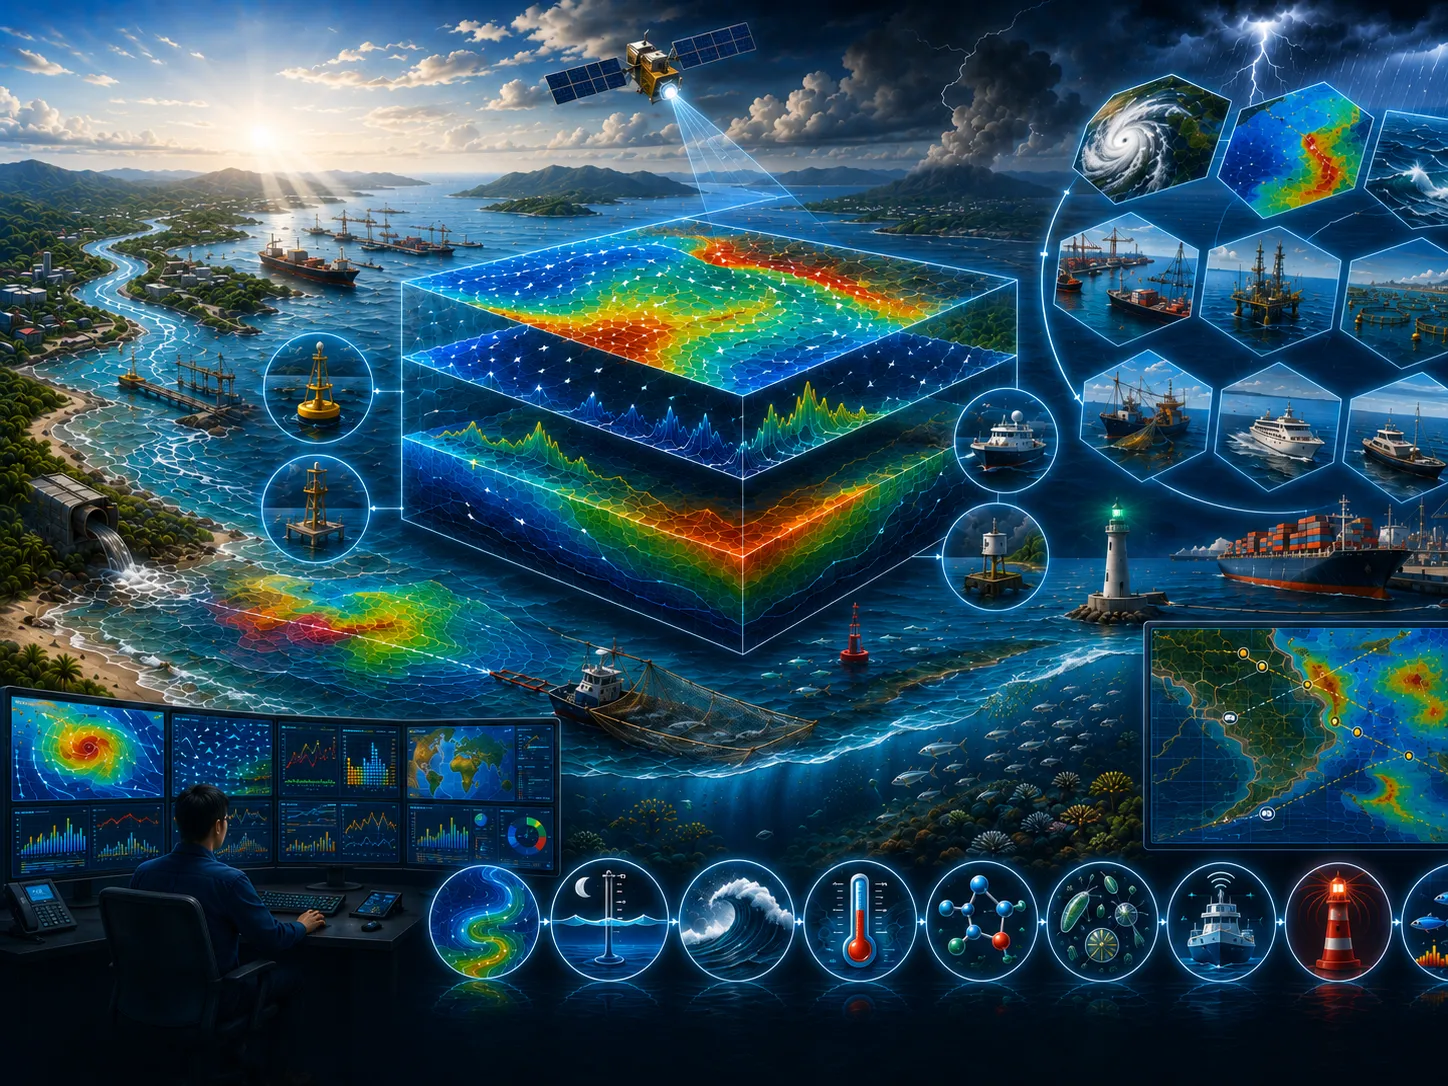
Field surveys, in-situ measurements, laboratory results, historical records, and operating information as required.
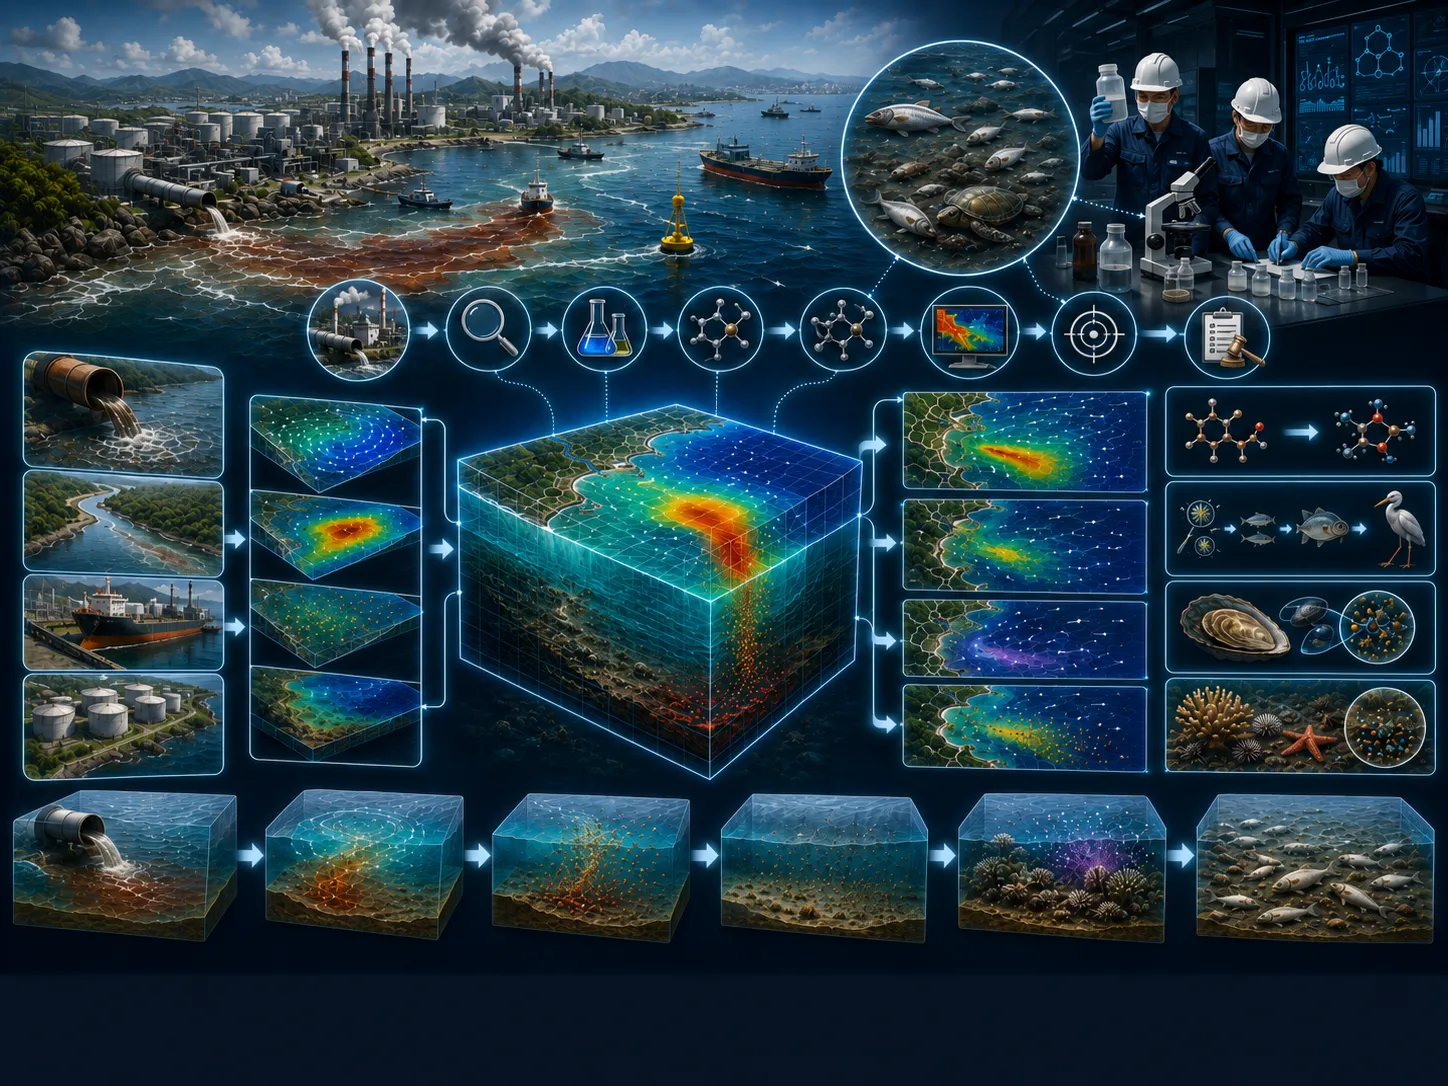
Satellite imagery, mapping, spatial analysis, temporal change, and integration of multiple data sources.
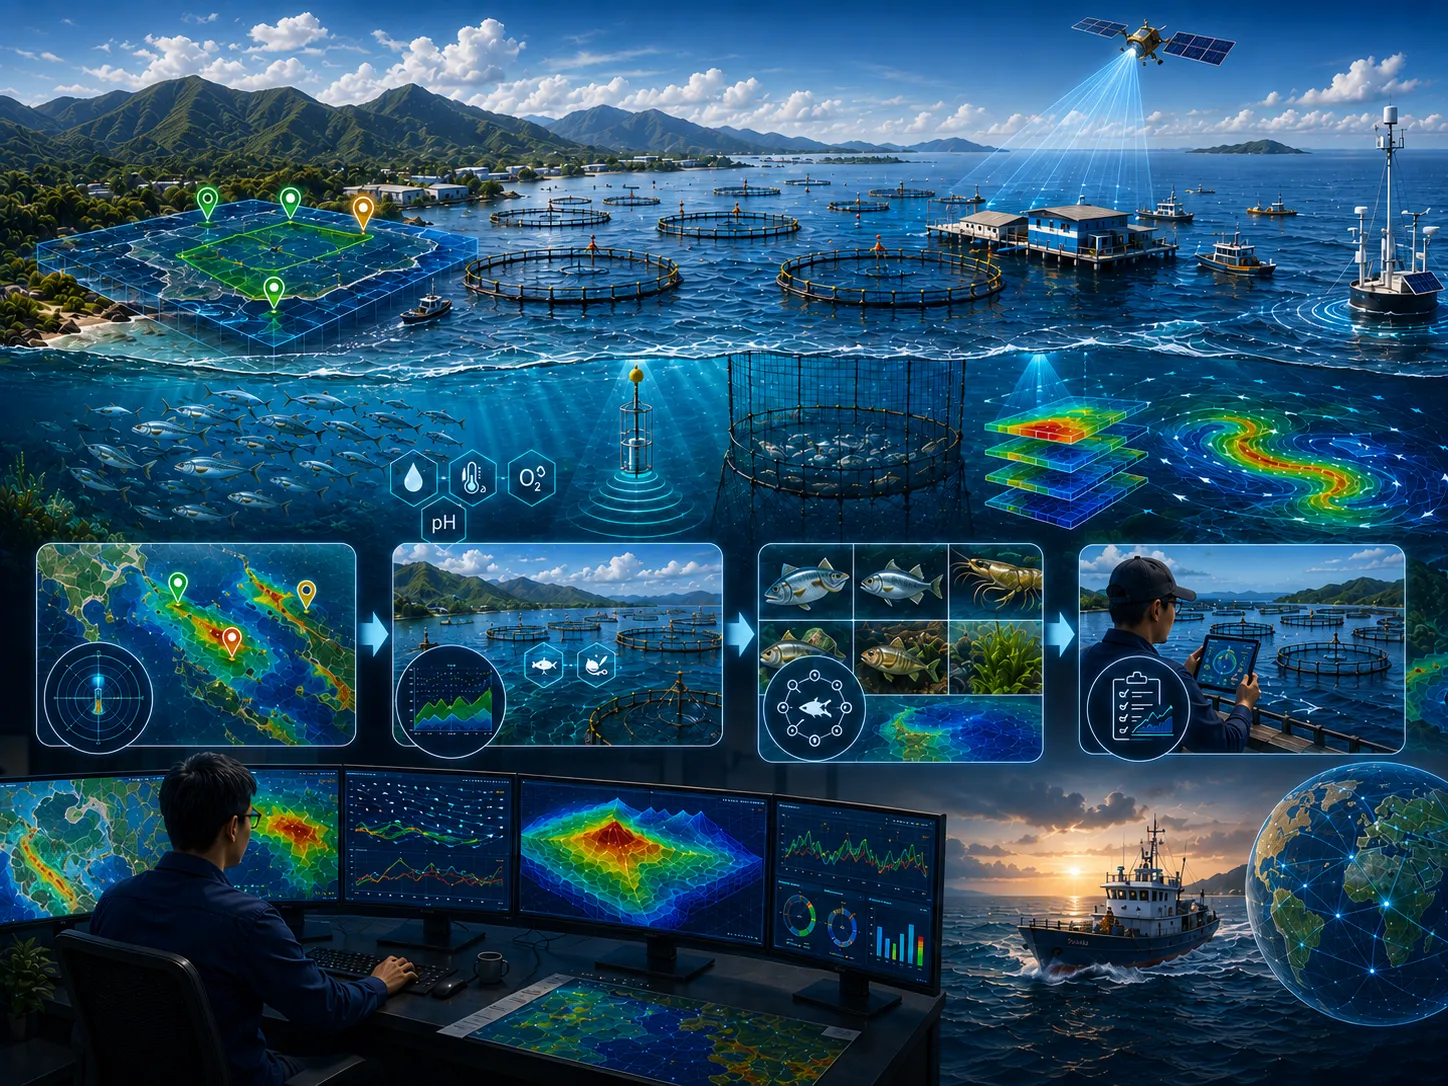
Model setup, calibration, validation, existing–planned–extreme scenarios, and sensitivity analysis.
Metadata, quality controls, assumptions, limitations, data versions, and processing lineage are documented.
Objectives, study area, available data, additional needs, initial risks, and recommended level of detail.
Quality-controlled data, thematic maps, time series, indicators, and comparable visualizations.
Comparison of existing conditions, alternatives, extremes, sensitivities, consequences, and mitigation options.
Methods, results, limitations, recommendations, action priorities, and stakeholder presentation materials.
Assumptions, data, variability, and limitations are stated so decision risk is not hidden.
Alternative locations, designs, operations, or policies are assessed using consistent indicators.
Data needs and analysis depth are proportionate to risk so resources are used efficiently.
Findings and recommendations are transparent for technical, management, regulatory, and partner review.
Objectives, users, location, project phase, problems, constraints, and the decision to support.
Methods, data, surveys, models, schedule, team, deliverables, review gates, and resource estimate.
Collection, inspection, harmonization, documentation, and data-sufficiency assessment.
Processing, modeling, validation, option comparison, sensitivity, and risk evaluation.
Maps, report, executive brief, presentation, supporting data, and follow-up plan.
Wave, tide, and tsunami flooding can occur due to rising sea levels during extreme high tides, the propagation of long waves from distant sources, and tsunami events. Extreme high tides may inundate coastal and nearshore lowland areas for a certain period, usually between two and five days, depending on the local tidal regime and land topography. Inundation depths caused by tidal flooding may reach approximately 1 to 2 meters.
Long waves generated from distant sources, such as Kelvin waves, Rossby waves, and internal solitary waves, may also cause flooding in low-lying and gently sloping coastal areas. In some cases, internal solitary waves can create more significant impacts due to their high wave energy. When these waves reach the coast, their height may range from approximately 1 to 3 meters and may penetrate farther inland along flat and low-lying coastal plains. The propagation of internal solitary waves can often be clearly observed using satellite radar imagery, which can detect wave patterns and sea surface variations in offshore waters.
Tsunami flooding is generally caused by undersea earthquakes and may produce severe impacts due to the very high energy and propagation speed of tsunami waves. However, not all undersea earthquakes generate tsunamis. Tsunami generation depends on the earthquake magnitude, focal depth, and the amount of seabed deformation. Wave heights near the earthquake source are generally smaller than the wave heights observed near the coast. As tsunami waves approach shallow coastal waters, their height increases due to changes in seabed topography and decreasing water depth. Tsunami inundation depths may range from 1 to 5 meters or even higher. However, the inundation period is usually relatively short because the water that enters the land returns to the sea within a short period as the system seeks equilibrium.
The hydrodynamic module is used to simulate tidal flooding and tsunami propagation. It can also accommodate wave flooding caused by distant long-wave sources such as Kelvin waves, Rossby waves, and internal solitary waves for large-scale model domains. Initial conditions related to sea level changes can be detected using radar imagery. Internal solitary waves are formed by water mass movement driven by variations in temperature, salinity, and pressure within the water column. These waves may develop when water masses move into shallow waters or narrow straits. Changes in temperature, salinity, and pressure can also be simulated using this module.
The CORZ team will review the objective, scope, data availability, risk level, schedule, and required outputs to prepare a proportionate approach.
Share the location, objectives, key challenges, available data, and expected outputs. The CORZ team will help define a proportionate technical approach.