CONTEXTField conditions and systems being assessed
Enter at least two characters.
Data processing plays an important role in modeling. Throughout the development of modeling scenarios, data processing is required, starting from the preparation of model input data and parameterization…
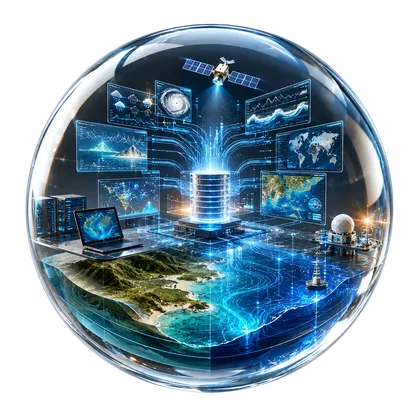
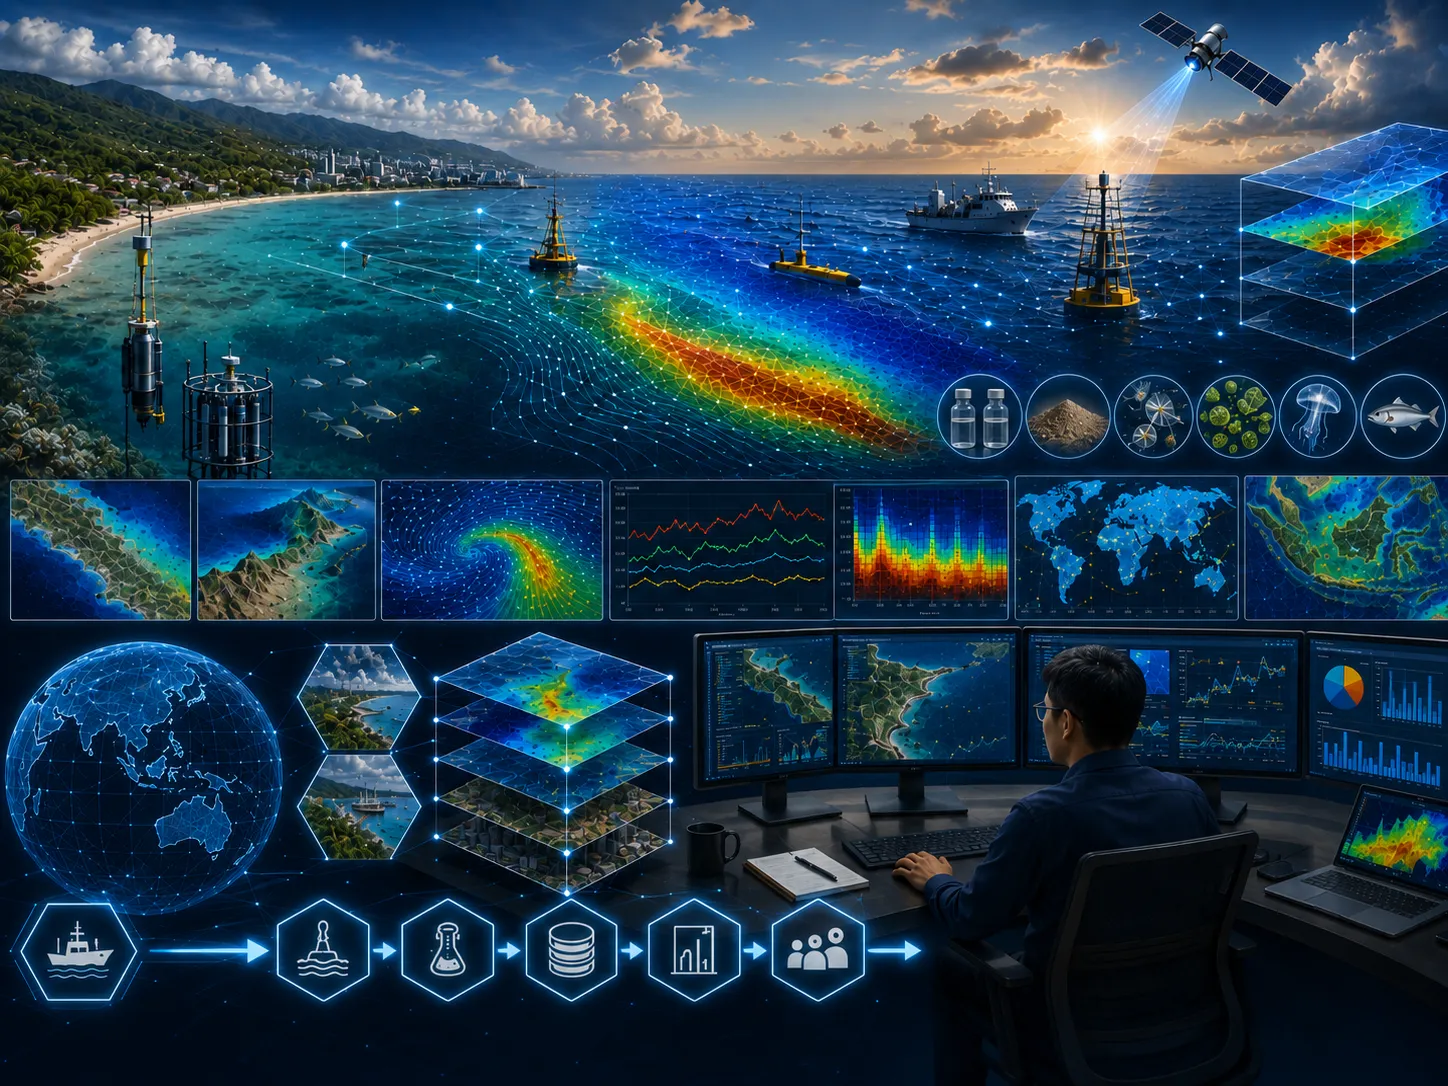
This page includes a one-page leaflet that can be opened in a full-image popup. It helps present the core CORZ service clearly and convincingly during project discussions, executive briefings, and decision-support meetings.
With a more proportional balance between visuals and text, the page feels brighter and more energetic while still keeping the important technical context visible and easy to understand.
Use this leaflet as a concise visual entry point before moving into the more detailed technical explanation.
Clarity before a decision is made
Data processing plays an important role in modeling. Throughout the development of modeling scenarios, data processing is required, starting from the preparation of model input data and parameterization…
Along with the development of satellite technology, various types of satellite imagery data are now available to monitor aquatic conditions. These satellite imagery data can be used as supporting information for model outputs.
Define the approach, priorities, and actions for data processing using traceable evidence.
Errors in projection, units, timing, quality control, interpolation, and interpretation.
Reproducible processing, verified results, and usable output formats.
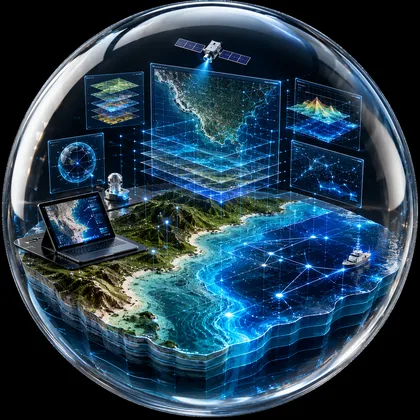
Mapping technology and Geographic Information System (GIS) analysis for marine applications have developed rapidly.
Learn more →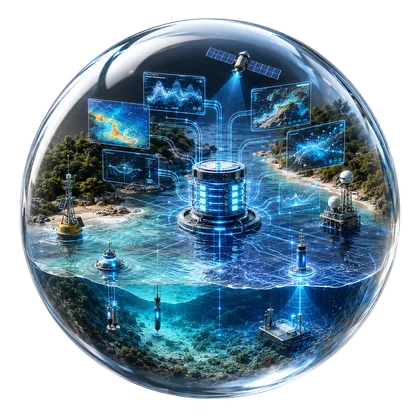
Coastal and marine data are highly dynamic. Changes in aquatic parameters occur over time, even when the changes are very small. Therefore, coastal and marine datasets can become very large when parameters…
Learn more →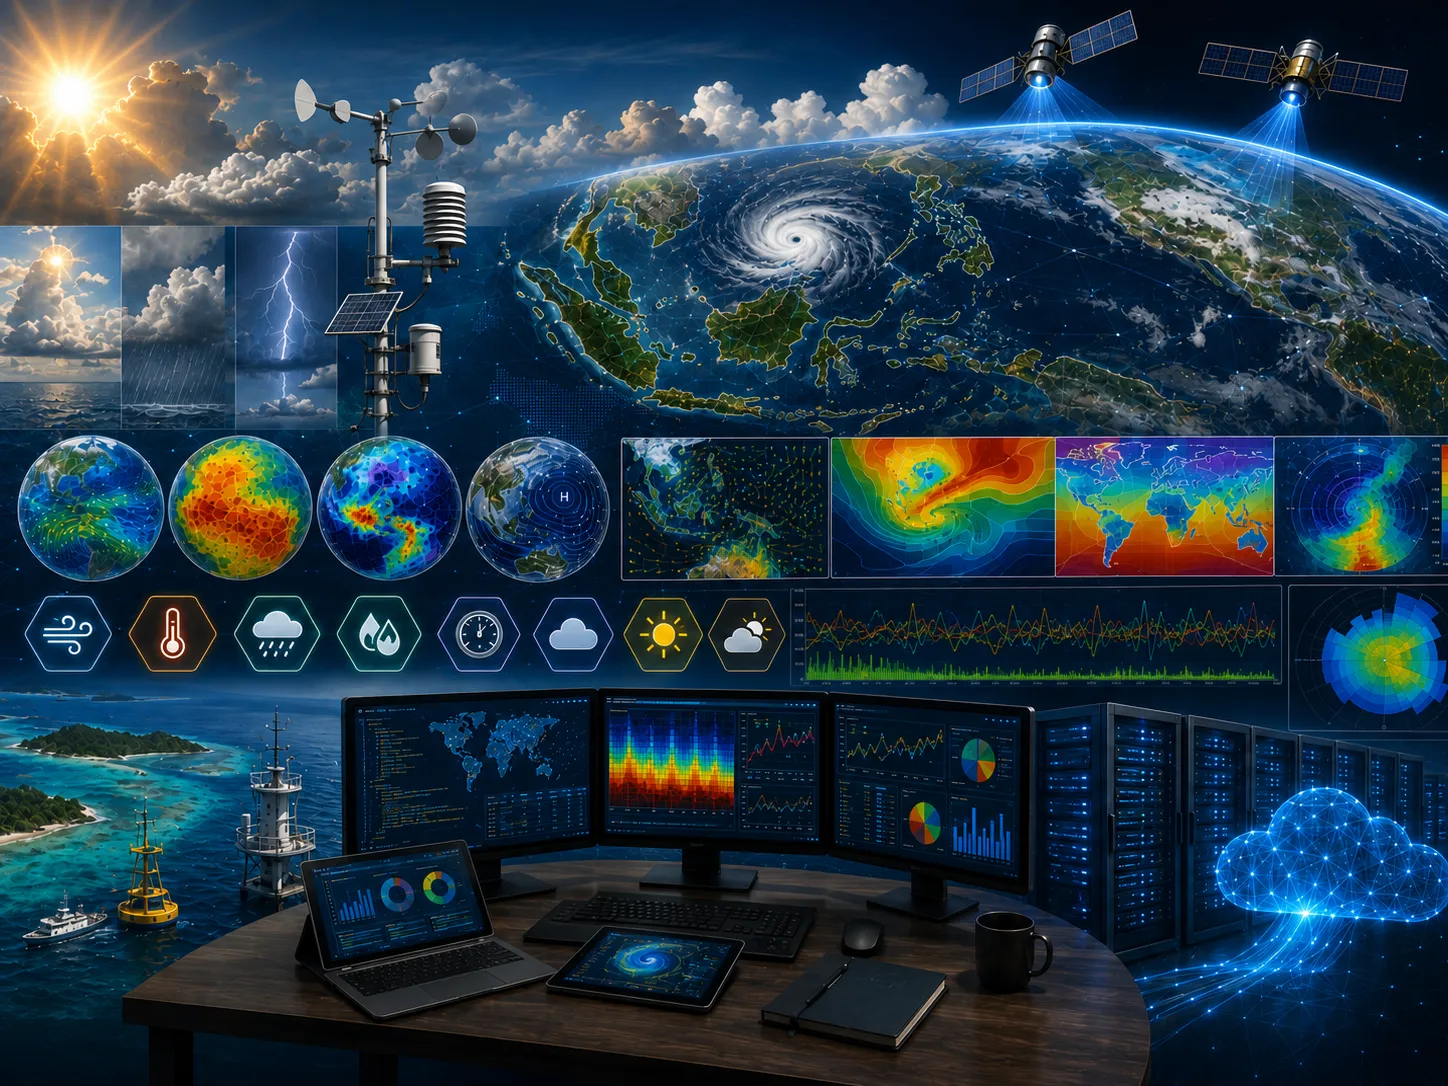
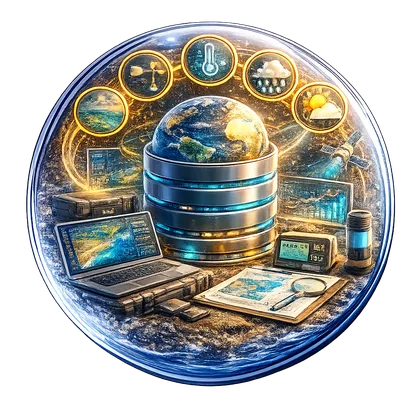
Weather and climate data in Indonesian waters are highly variable because of the many climate phenomena that influence the region.
Learn more →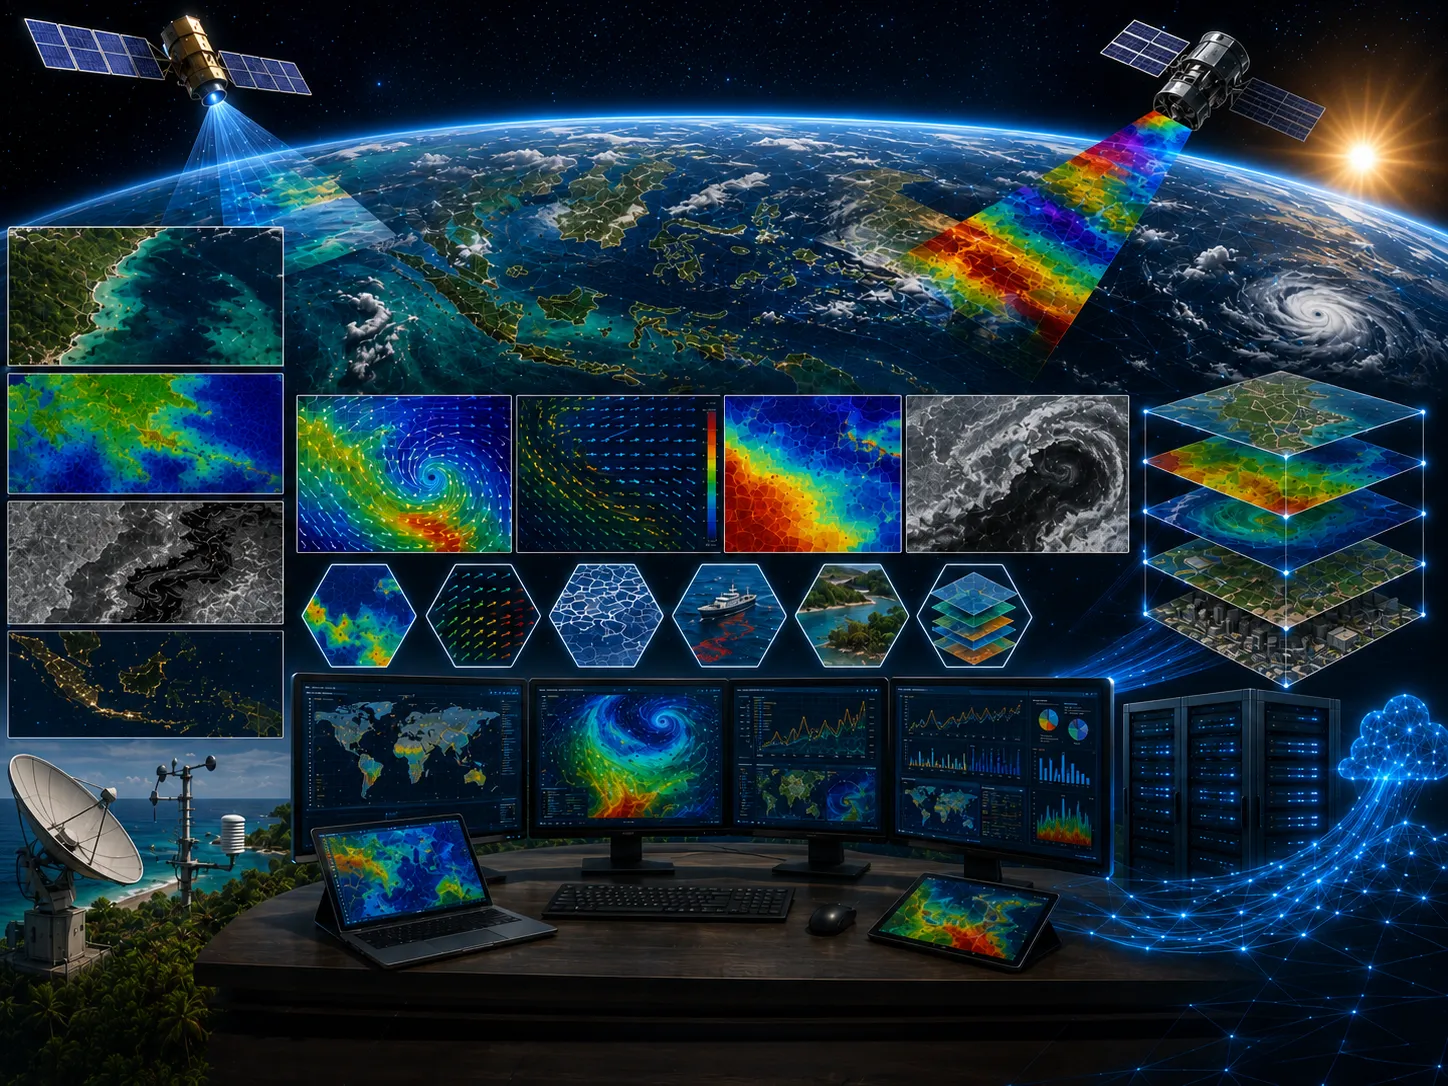
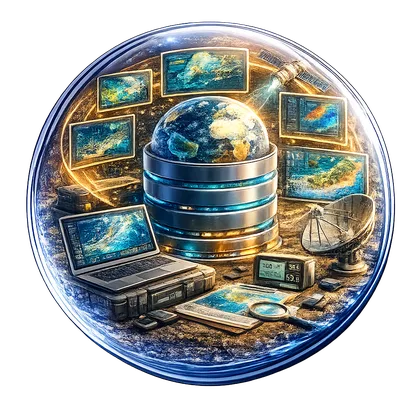
Marine remote sensing technology is currently developing rapidly, along with advances in sensor technology for detecting objects on the water surface.
Learn more →
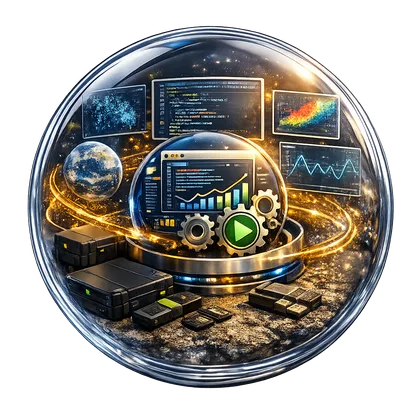
Model input and output data processing, or other types of data processing that are carried out continuously or repeatedly within a certain period, need to be supported by application programs developed…
Learn more →Field surveys, in-situ measurements, laboratory results, historical records, and operating information as required.
Satellite imagery, mapping, spatial analysis, temporal change, and integration of multiple data sources.
Model setup, calibration, validation, existing–planned–extreme scenarios, and sensitivity analysis.
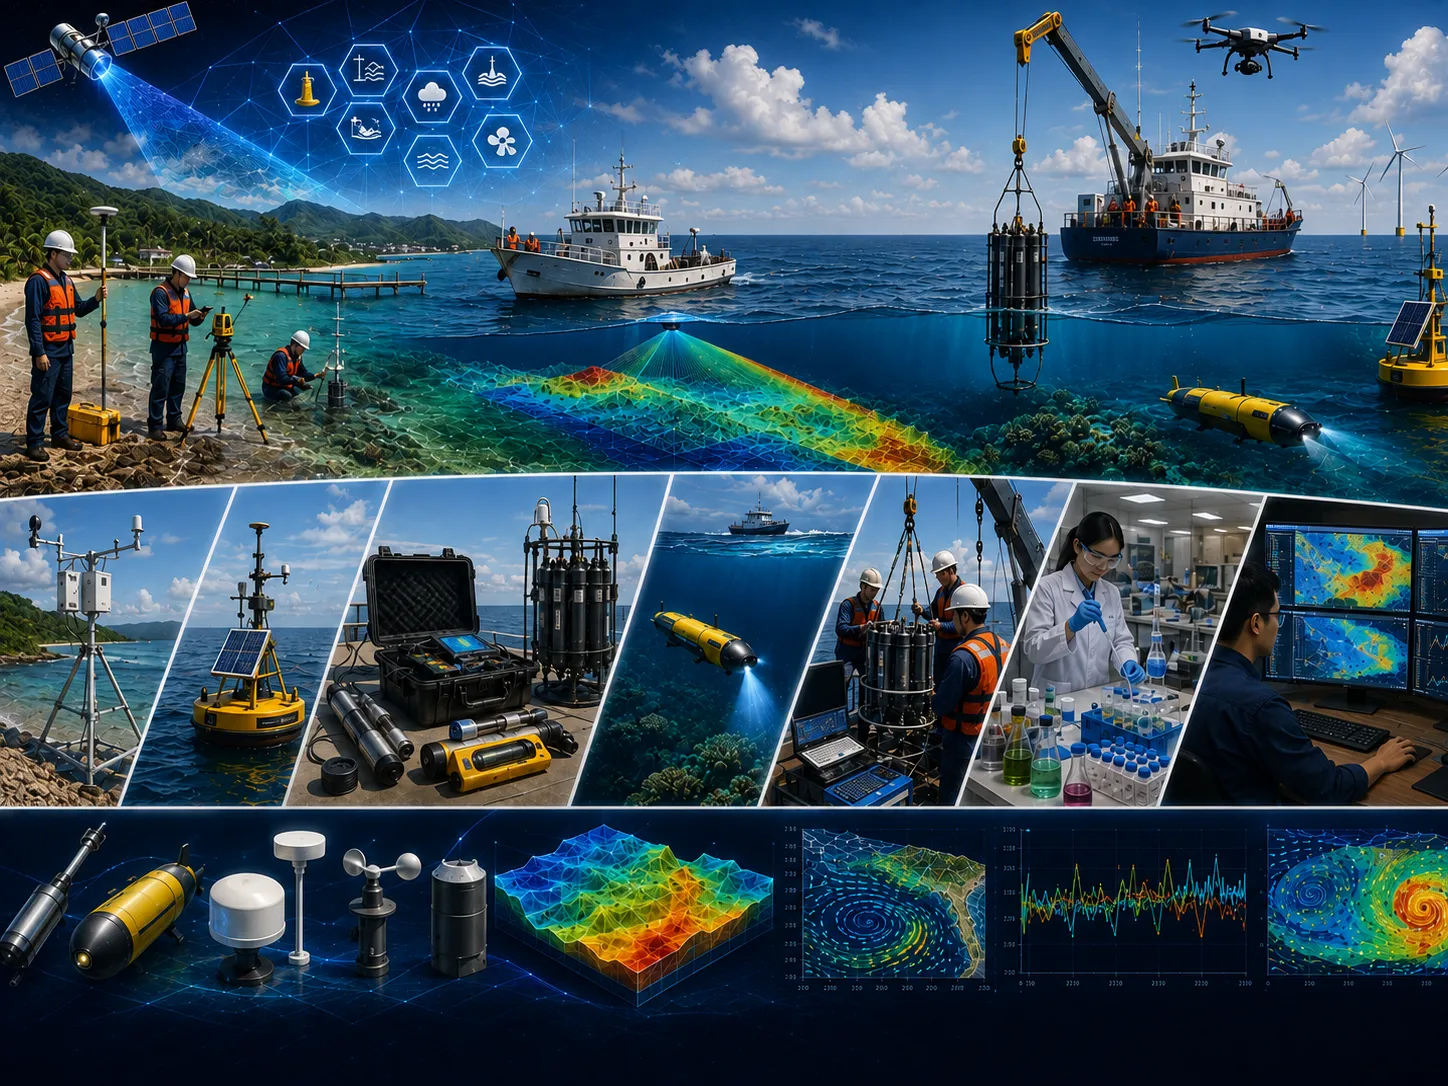
Metadata, quality controls, assumptions, limitations, data versions, and processing lineage are documented.
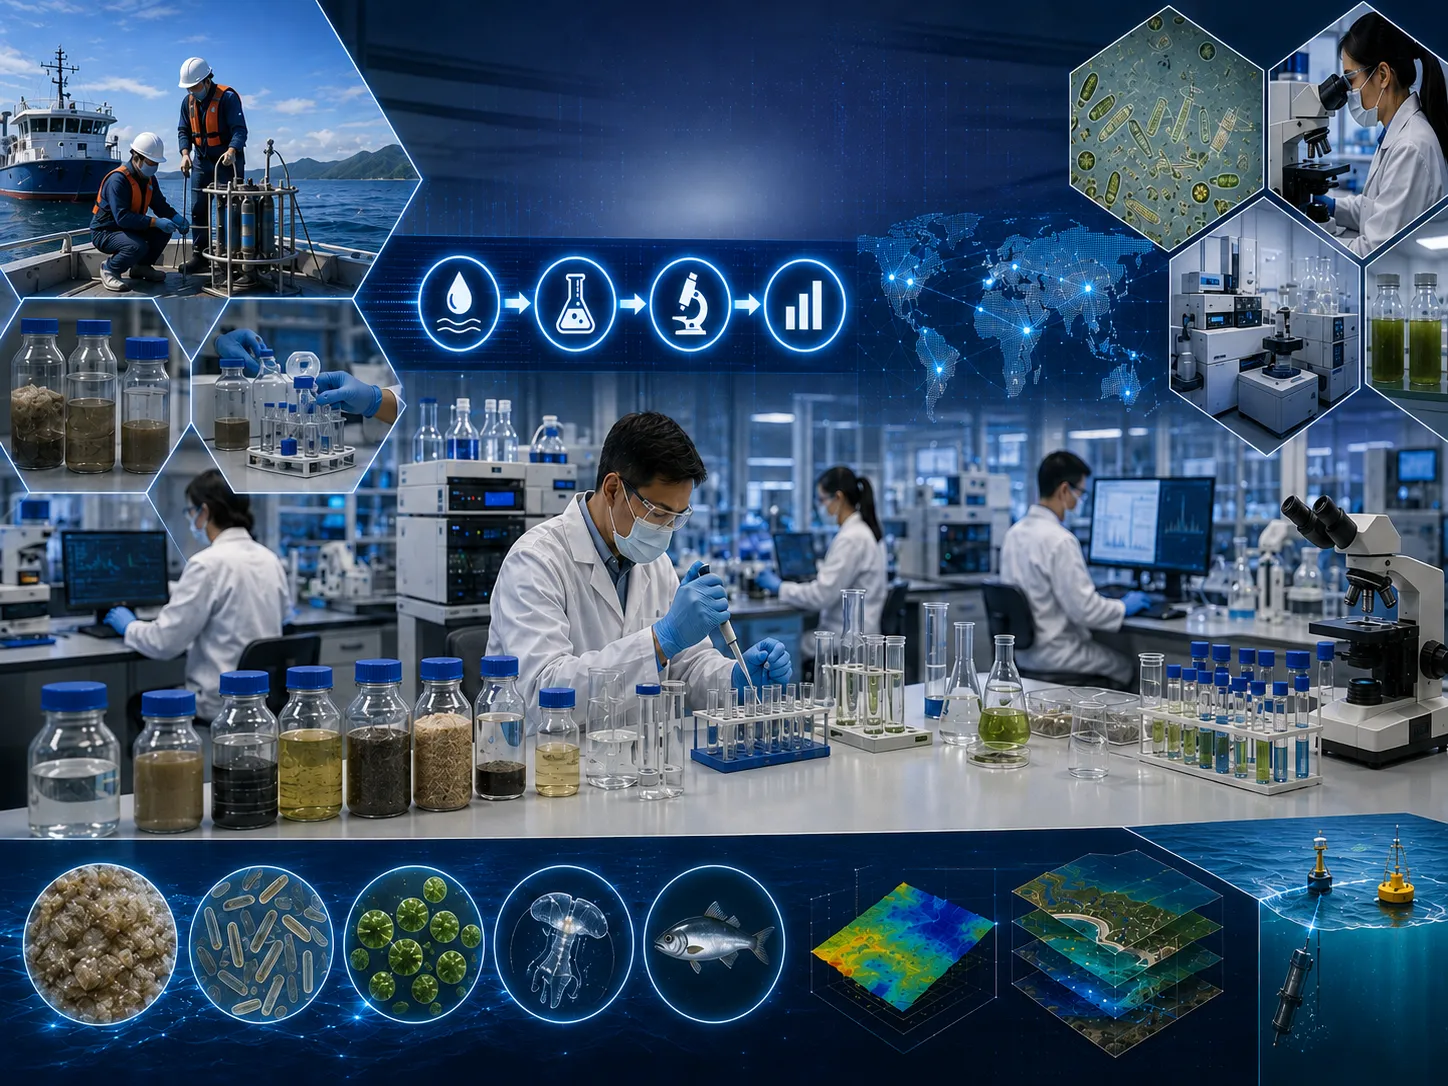
Objectives, study area, available data, additional needs, initial risks, and recommended level of detail.
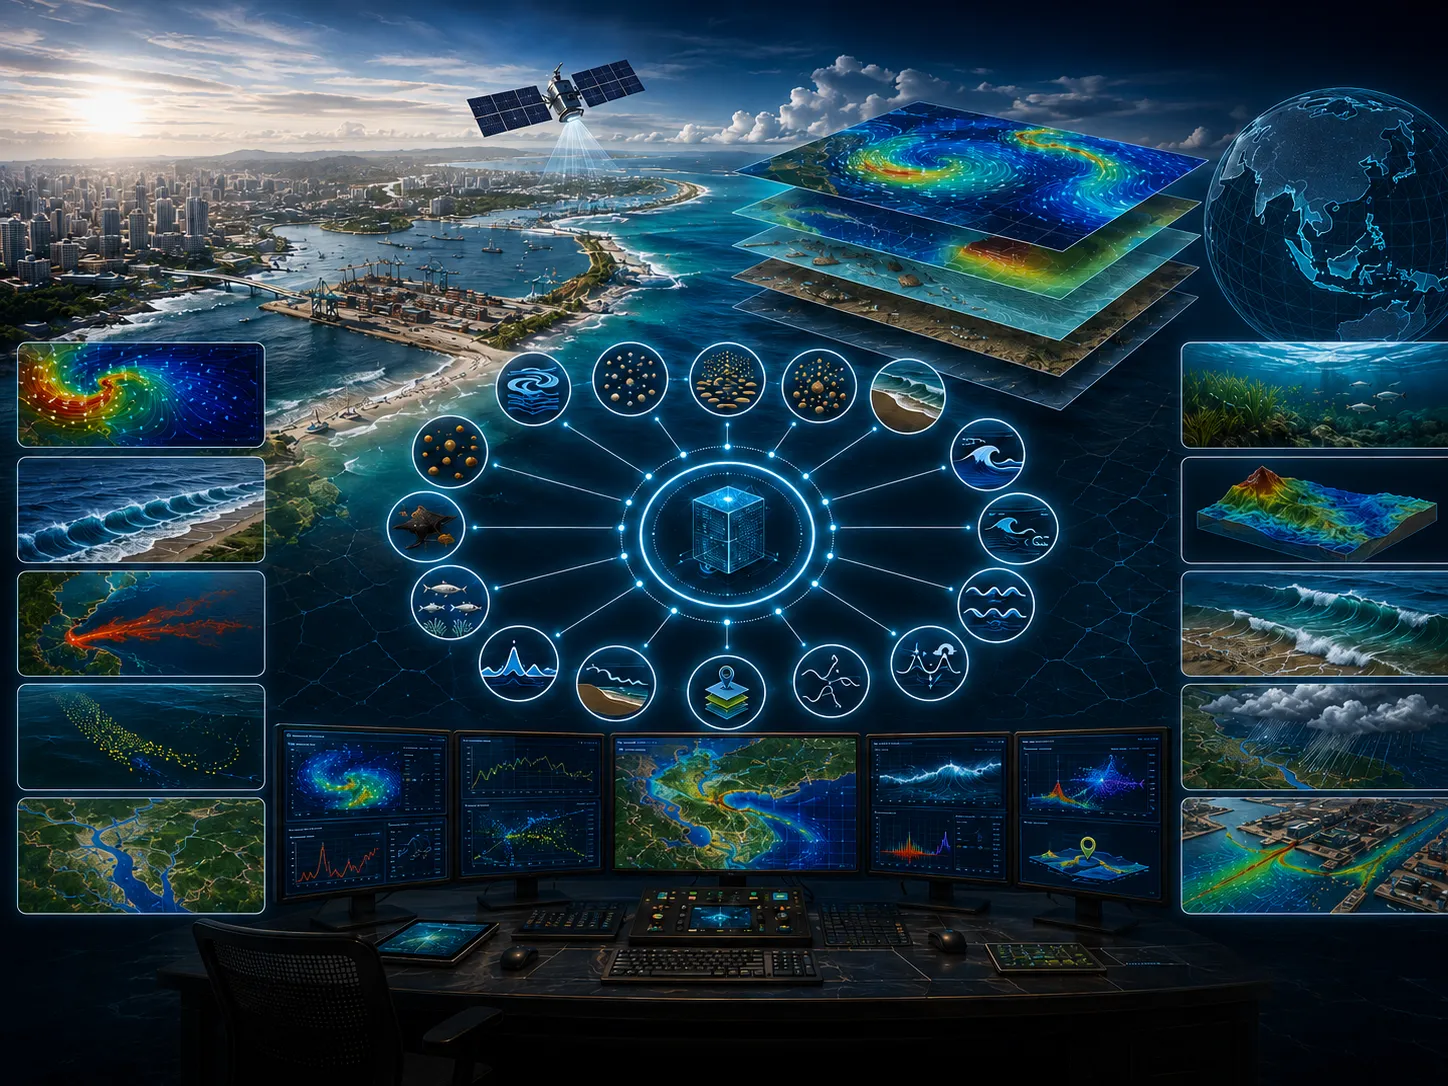
Quality-controlled data, thematic maps, time series, indicators, and comparable visualizations.
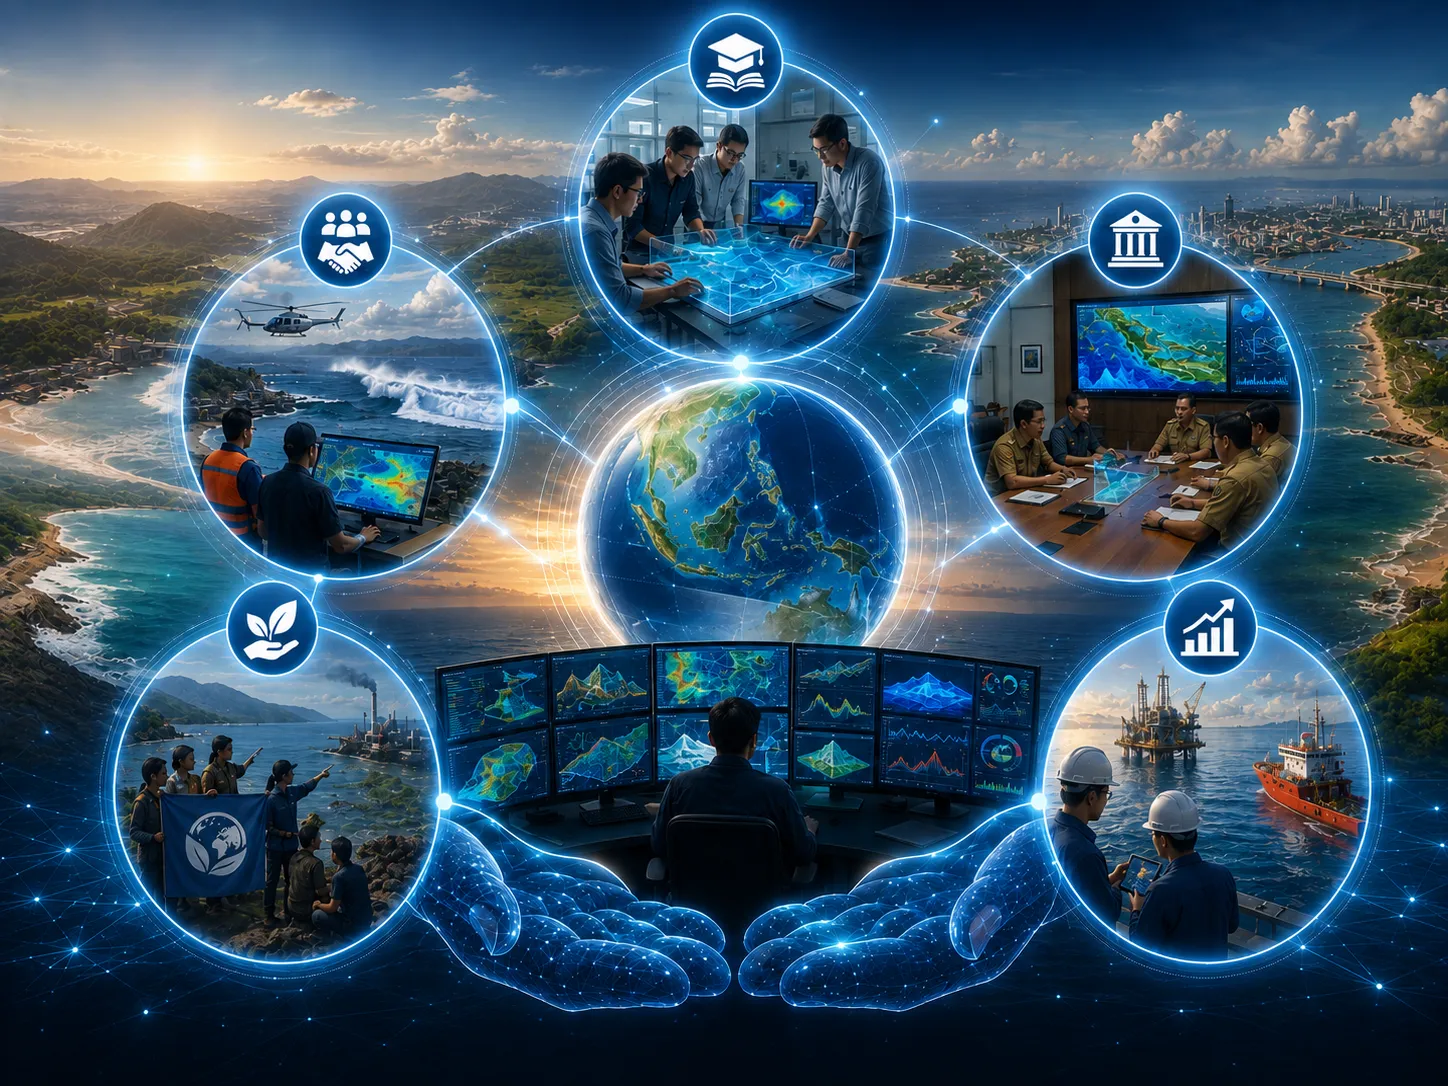
Comparison of existing conditions, alternatives, extremes, sensitivities, consequences, and mitigation options.
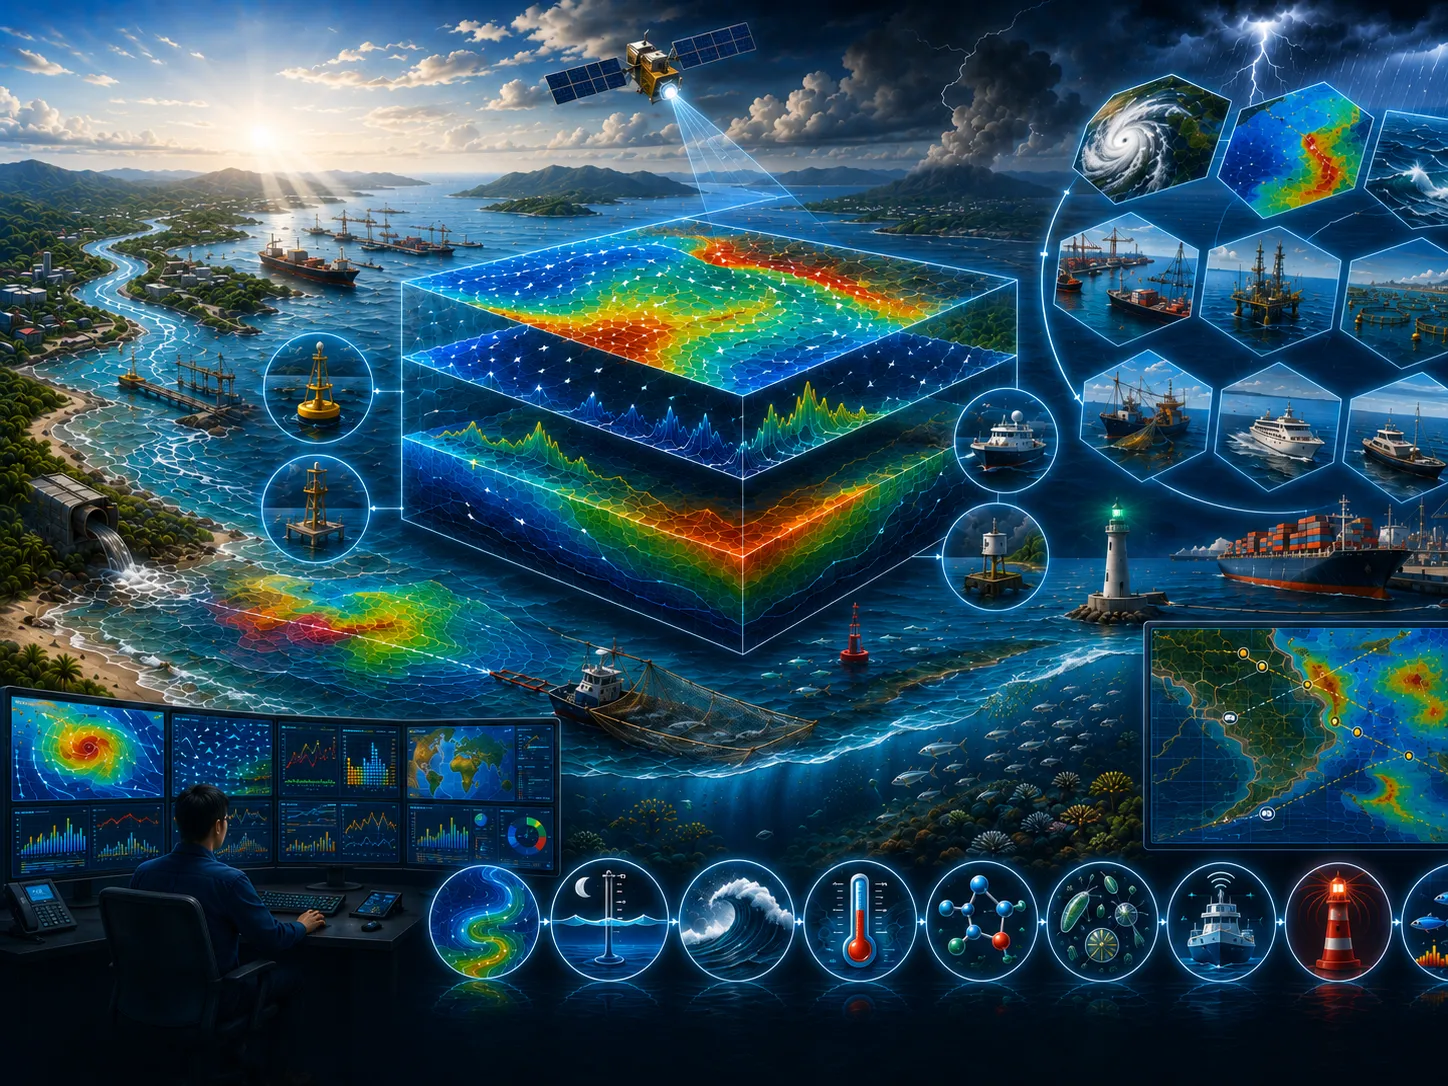
Methods, results, limitations, recommendations, action priorities, and stakeholder presentation materials.
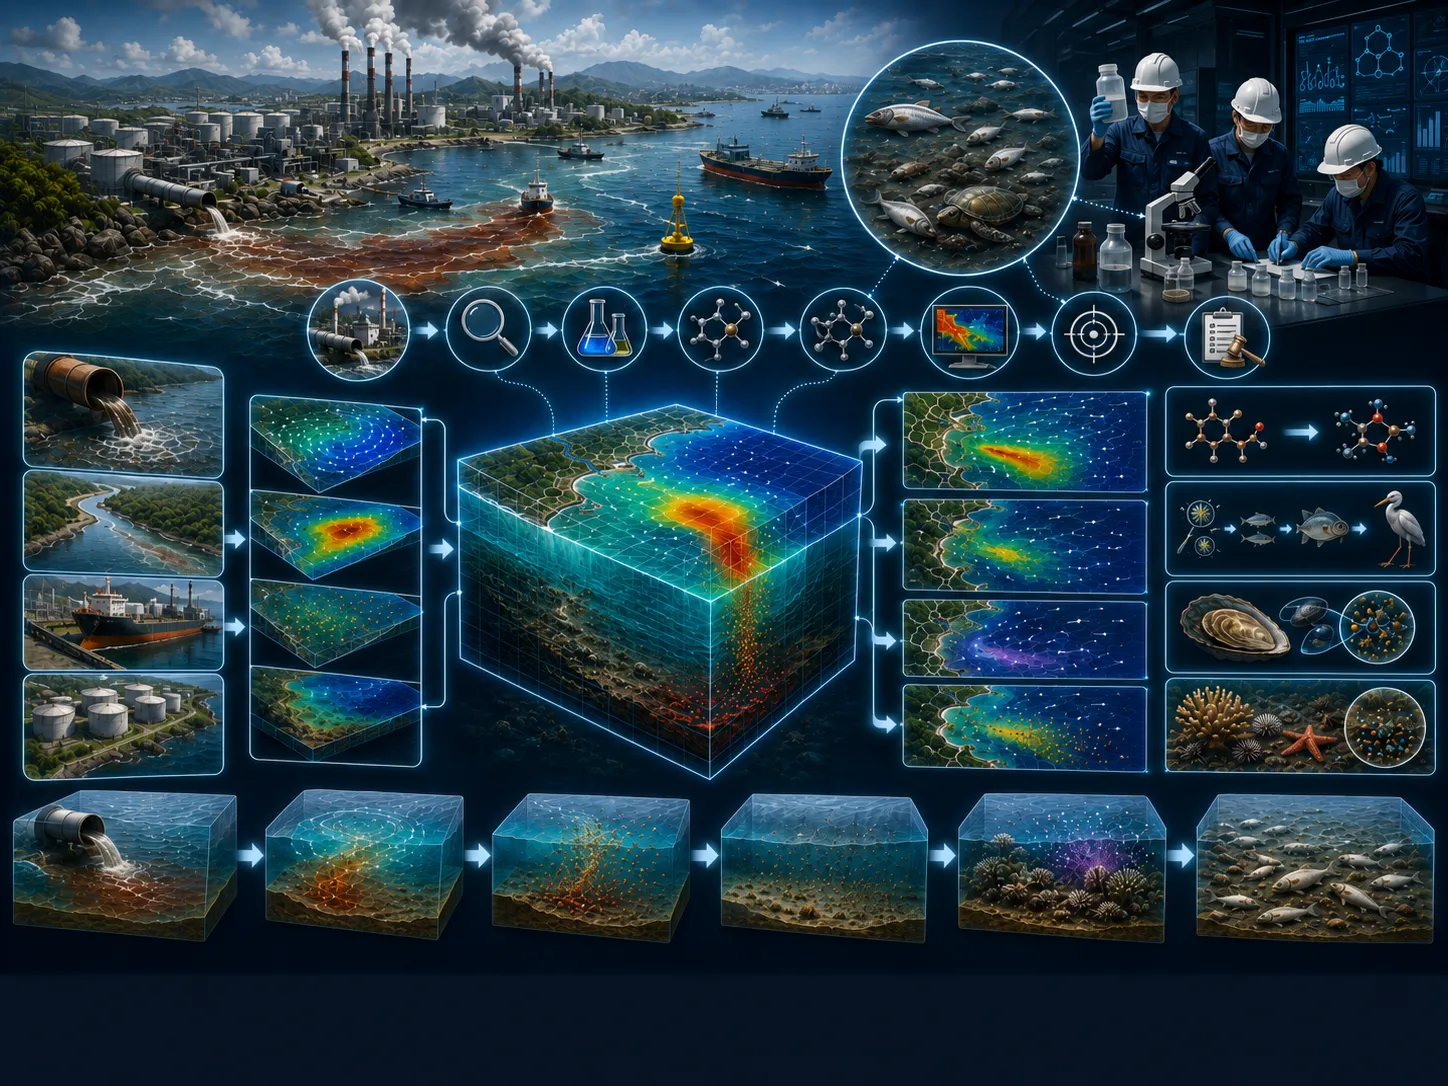
Assumptions, data, variability, and limitations are stated so decision risk is not hidden.
Alternative locations, designs, operations, or policies are assessed using consistent indicators.
Data needs and analysis depth are proportionate to risk so resources are used efficiently.
Findings and recommendations are transparent for technical, management, regulatory, and partner review.
Objectives, users, location, project phase, problems, constraints, and the decision to support.
Methods, data, surveys, models, schedule, team, deliverables, review gates, and resource estimate.
Collection, inspection, harmonization, documentation, and data-sufficiency assessment.
Processing, modeling, validation, option comparison, sensitivity, and risk evaluation.
Maps, report, executive brief, presentation, supporting data, and follow-up plan.
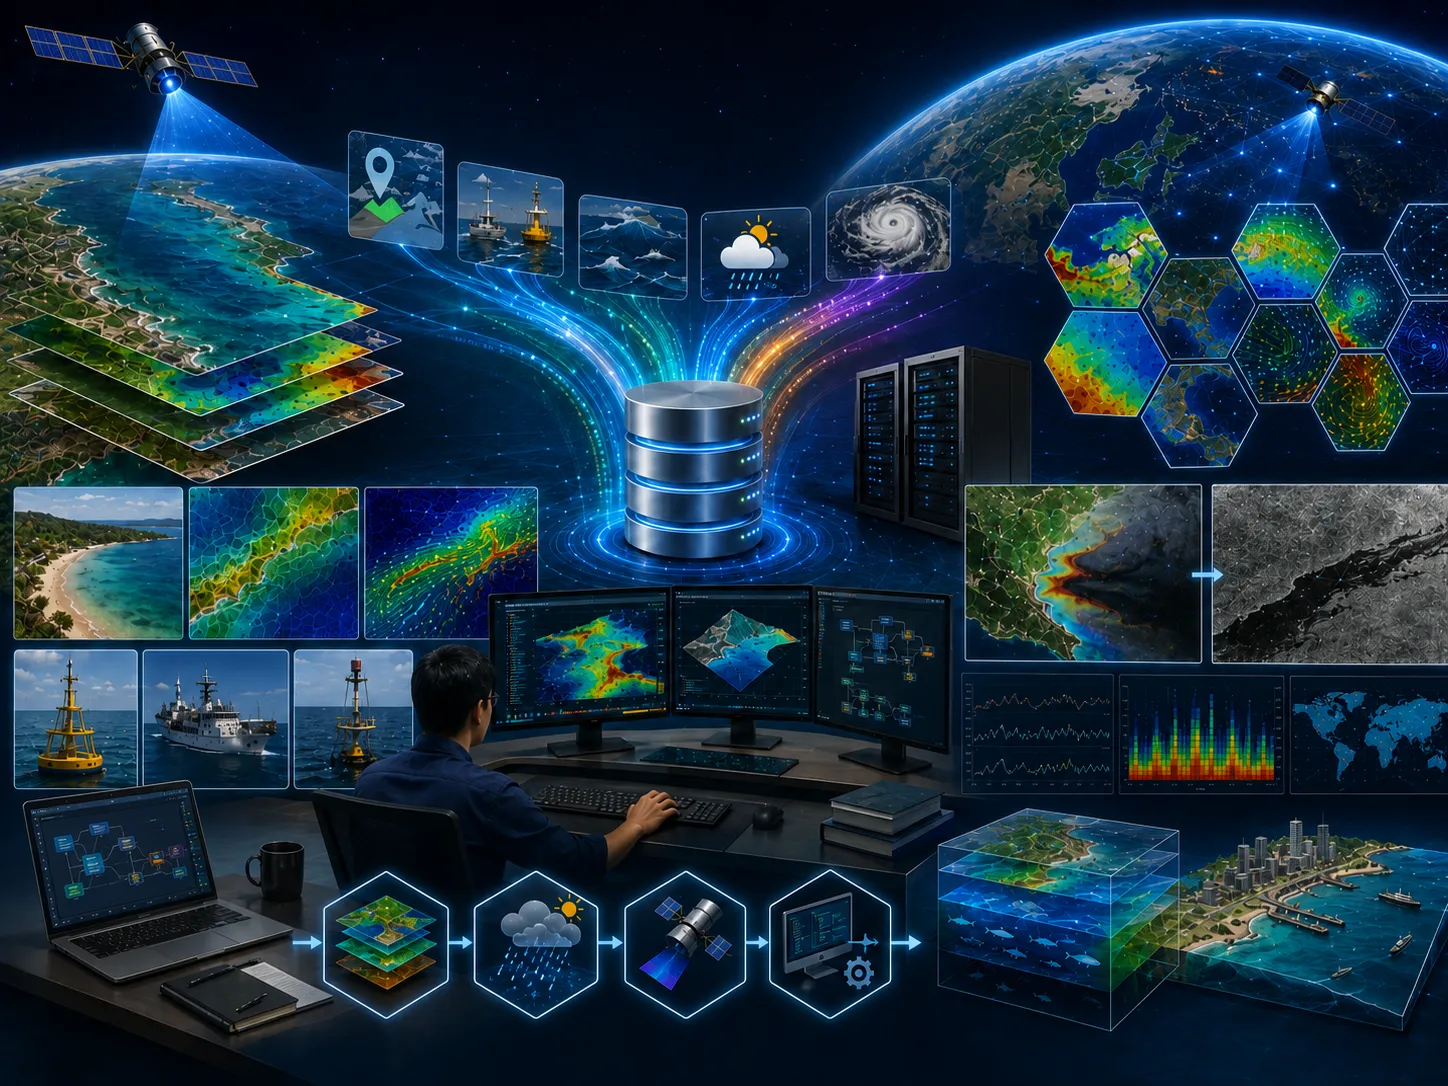
Data processing plays an important role in modeling. Throughout the development of modeling scenarios, data processing is required, starting from the preparation of model input data and parameterization data to the processing of model output data. Coastal, marine, weather, and climate data need to be processed before they can be used in modeling or applied in the model verification and validation process. Mapping data processing through geographic information system analysis is also needed to help modeling activities by adding other information derived from model outputs.
Along with the development of satellite technology, various types of satellite imagery data are now available to monitor aquatic conditions. These satellite imagery data can be used as supporting information for model outputs. The satellite imagery data need to be processed so they can be used in modeling technology. Processed satellite imagery data are also highly useful in the model verification and validation process because satellite imagery provides broad spatial coverage at the same time. For example, the output of an oil spill model module can show the distribution pattern of spilled oil after a certain period. At the same time, Radarsat satellite imagery may be available and can be processed to observe the oil spill distribution pattern. By comparing the model output with the Radarsat satellite imagery, it can be qualitatively assessed how accurately the oil spill model simulates the spilled oil.
In some cases, data processing is carried out continuously. Therefore, an application in the form of software is needed, developed according to specific data processing requirements. This software can provide effective support because the work does not need to be done manually and repeatedly. Instead, the process can be carried out automatically by the developed software. As a result, all stages of data processing for preparing model input data and processing model output data can be performed automatically by the software.
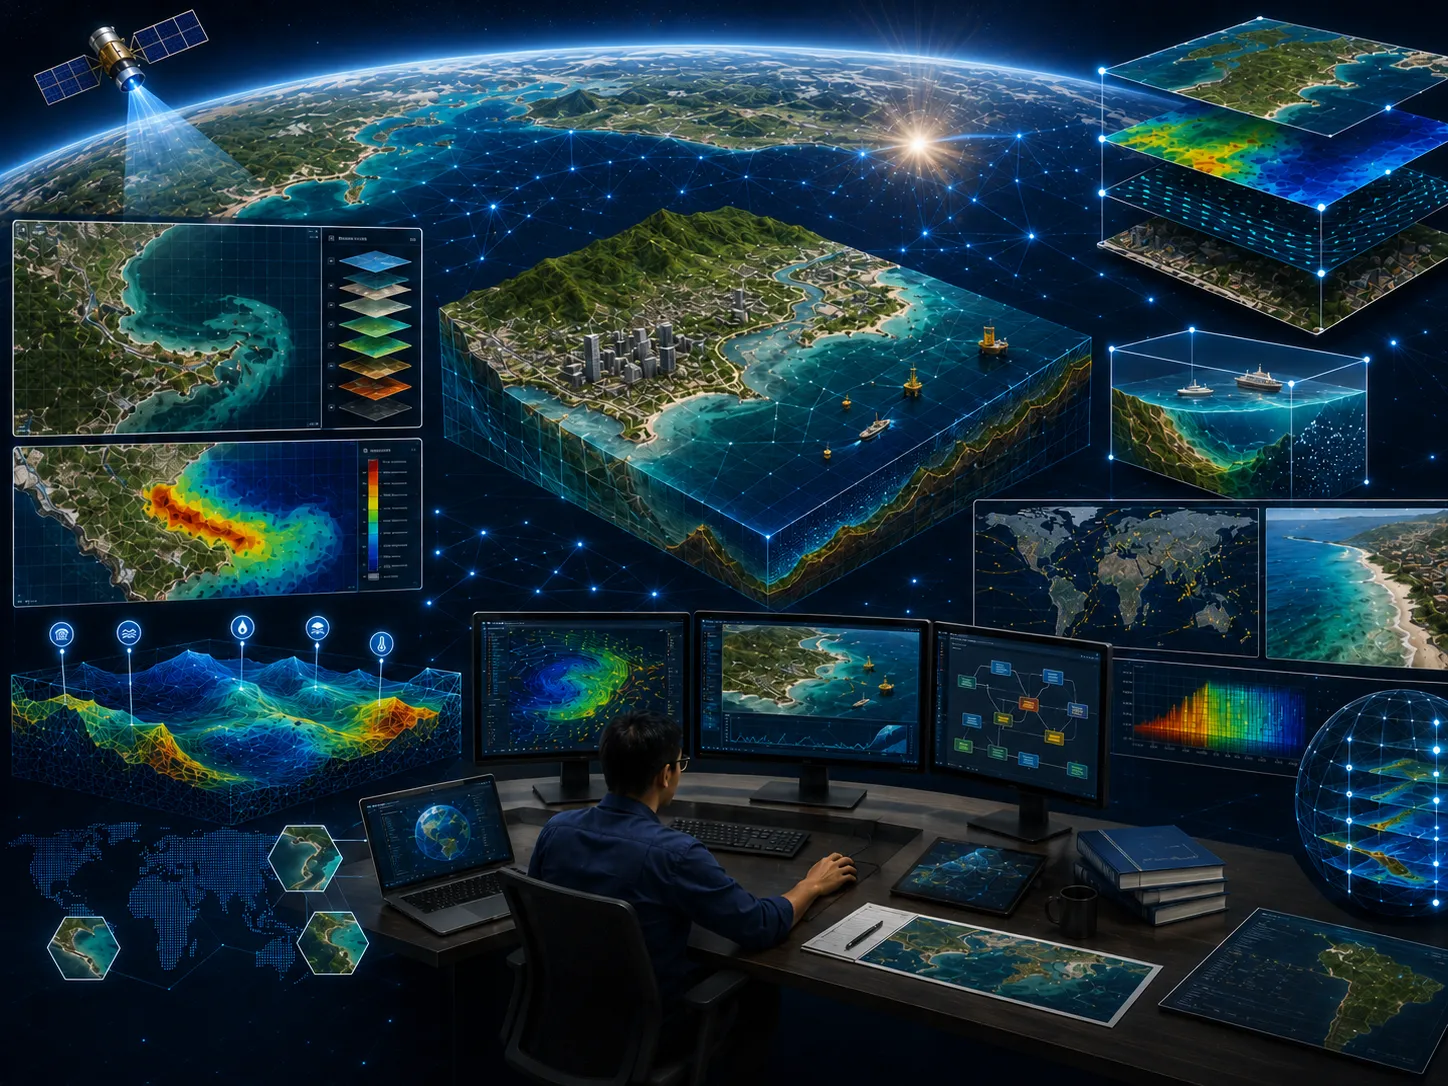
CORZ turns data, numerical modeling, and multidisciplinary expertise into actionable recommendations for government, industry, researchers, and civil society organizations.
Learn more →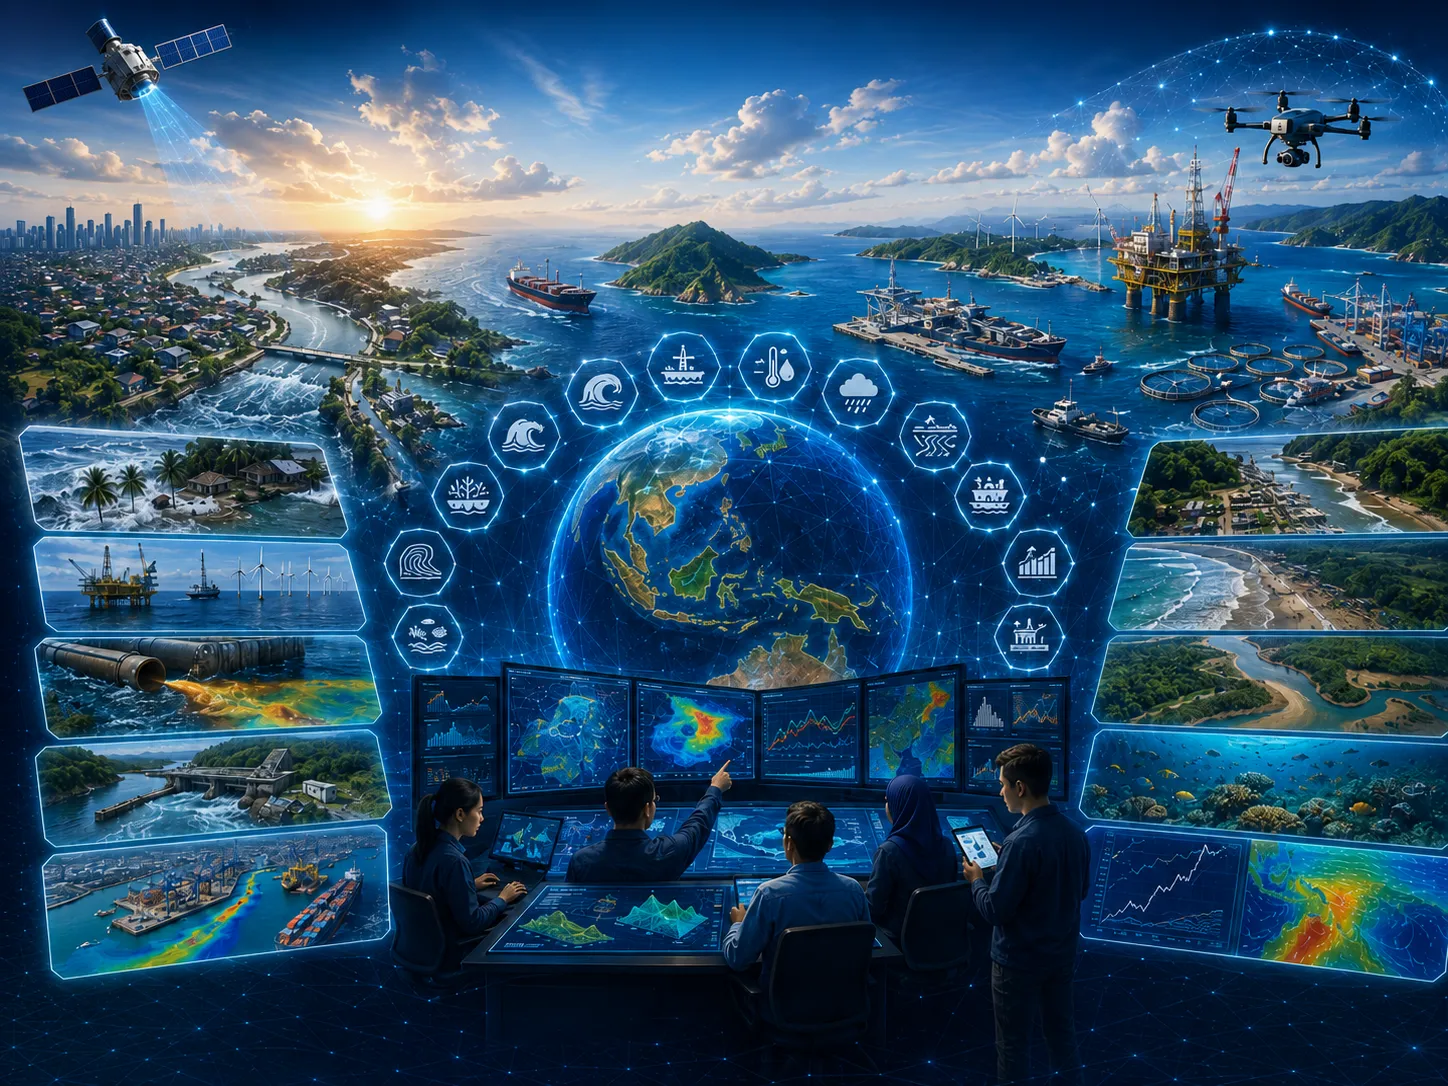
Indonesia, with one of the world's largest marine areas and longest coastlines, offers tremendous opportunities for offshore development and sustainable ocean-based industries.
Learn more →A wide range of numerical modeling modules can be applied to address coastal and marine challenges.
Learn more →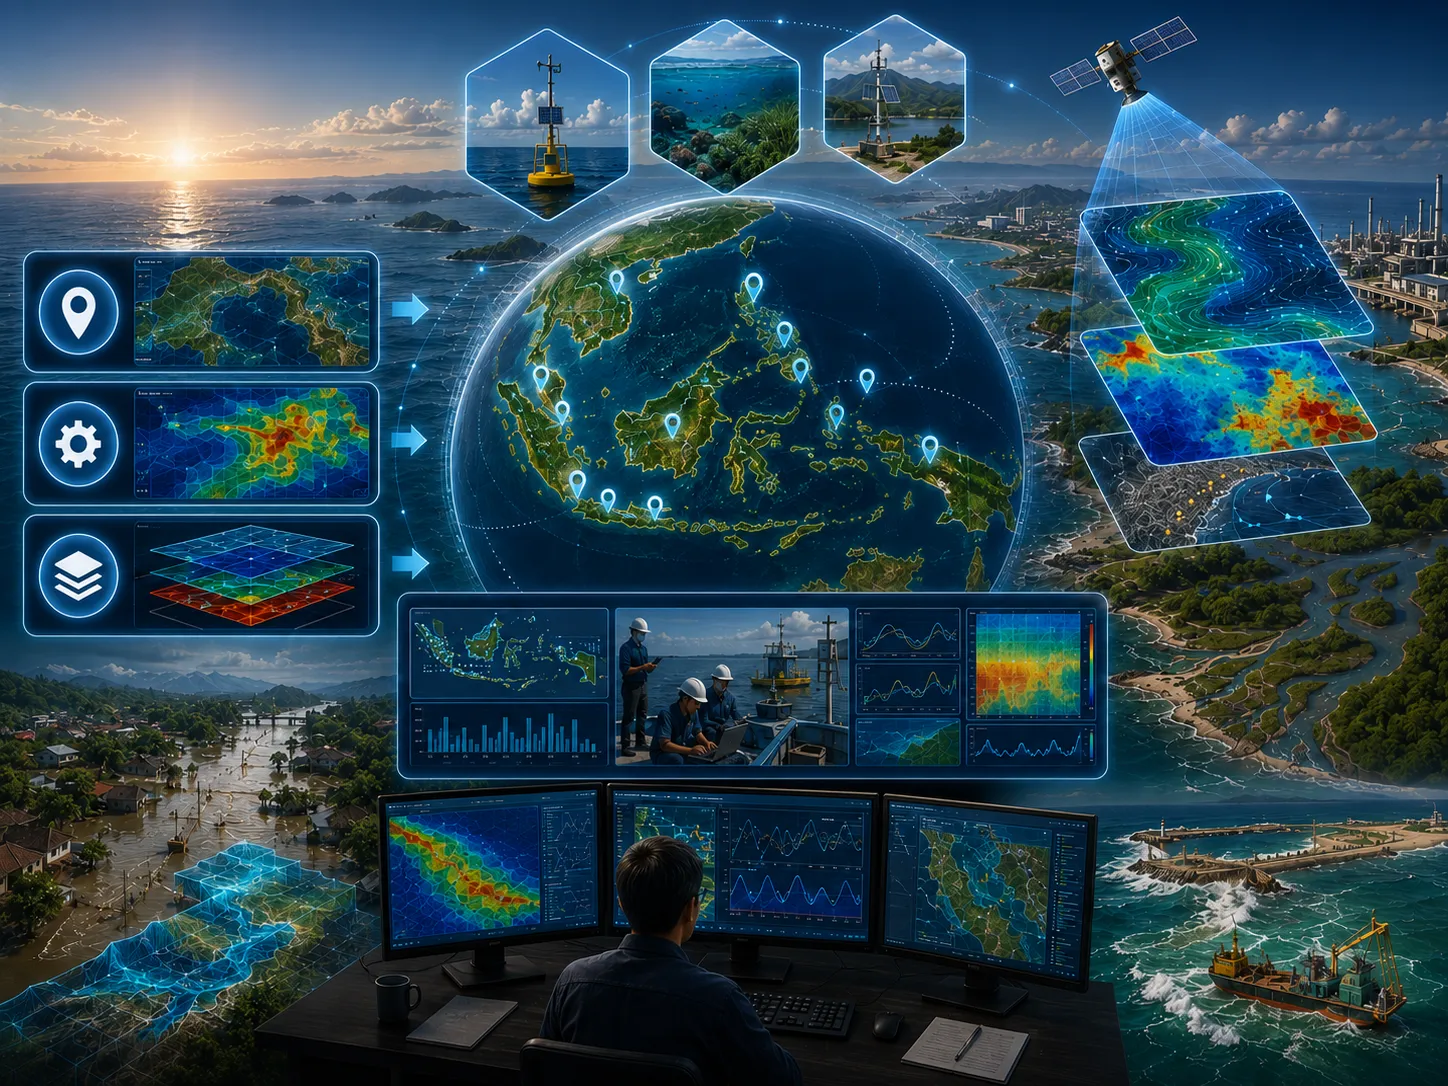
Various studies and assessments using modeling technology have been conducted in several Indonesian waters.
Learn more →The CORZ team will review the objective, scope, data availability, risk level, schedule, and required outputs to prepare a proportionate approach.
Share the location, objectives, key challenges, available data, and expected outputs. The CORZ team will help define a proportionate technical approach.