

CONTEXTField conditions and systems being assessed
Enter at least two characters.
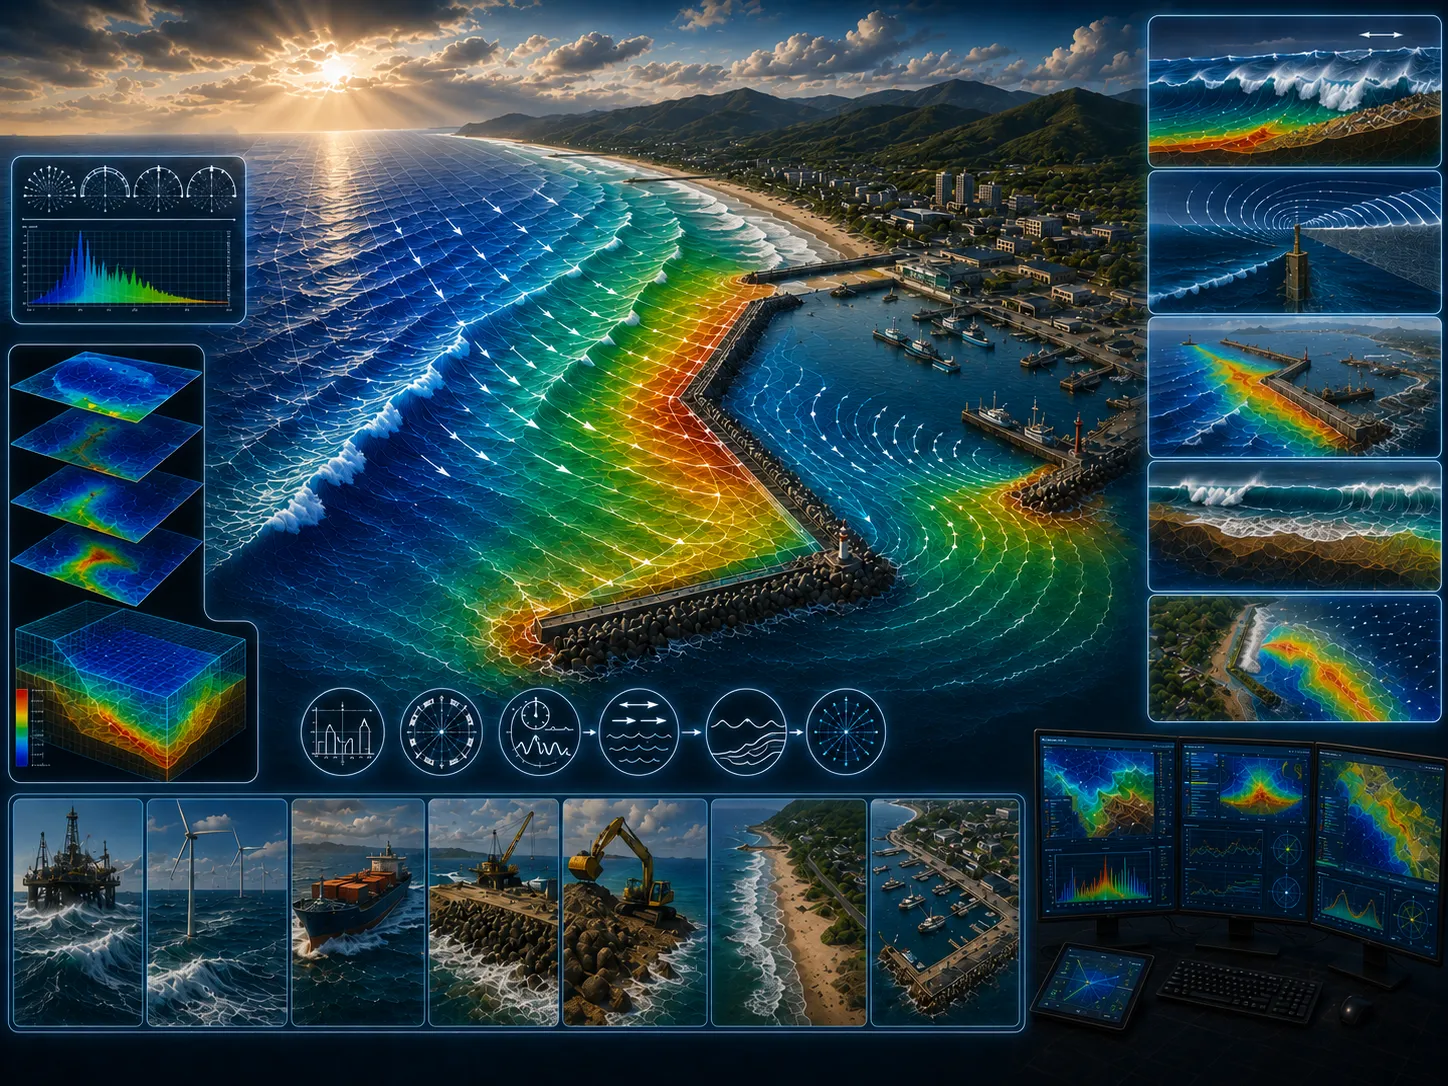
The Parabolic Mild Slope Wave Model Module is a linear wave refraction–diffraction model based on a parabolic approximation of the elliptic mild-slope equation.
This page includes a one-page leaflet that can be opened in a full-image popup. It helps present the core CORZ service clearly and convincingly during project discussions, executive briefings, and decision-support meetings.
With a more proportional balance between visuals and text, the page feels brighter and more energetic while still keeping the important technical context visible and easy to understand.
Use this leaflet as a concise visual entry point before moving into the more detailed technical explanation.


Clarity before a decision is made
The Parabolic Mild Slope Wave Model Module is a linear wave refraction–diffraction model based on a parabolic approximation of the elliptic mild-slope equation.
This wave module is based on equations derived from the parabolic approximation of the mild-slope equation. Several parabolic approaches can be applied, ranging from a simple approximation for small wave angles to more advanced formulations for larger wave angles, up to approximately 60°.
Define when and how to use parabolic mild slope wave model, including required data, configuration, validation, and scenarios.
Non-representative models, insufficient data, weak validation, and over-interpretation.
Transparent, validated models that respond to scenarios at the decision scale.
This aspect is assessed to clarify its implications for parabolic mild slope wave model.
This aspect is assessed to clarify its implications for parabolic mild slope wave model.
This aspect is assessed to clarify its implications for parabolic mild slope wave model.

This aspect is assessed to clarify its implications for parabolic mild slope wave model.
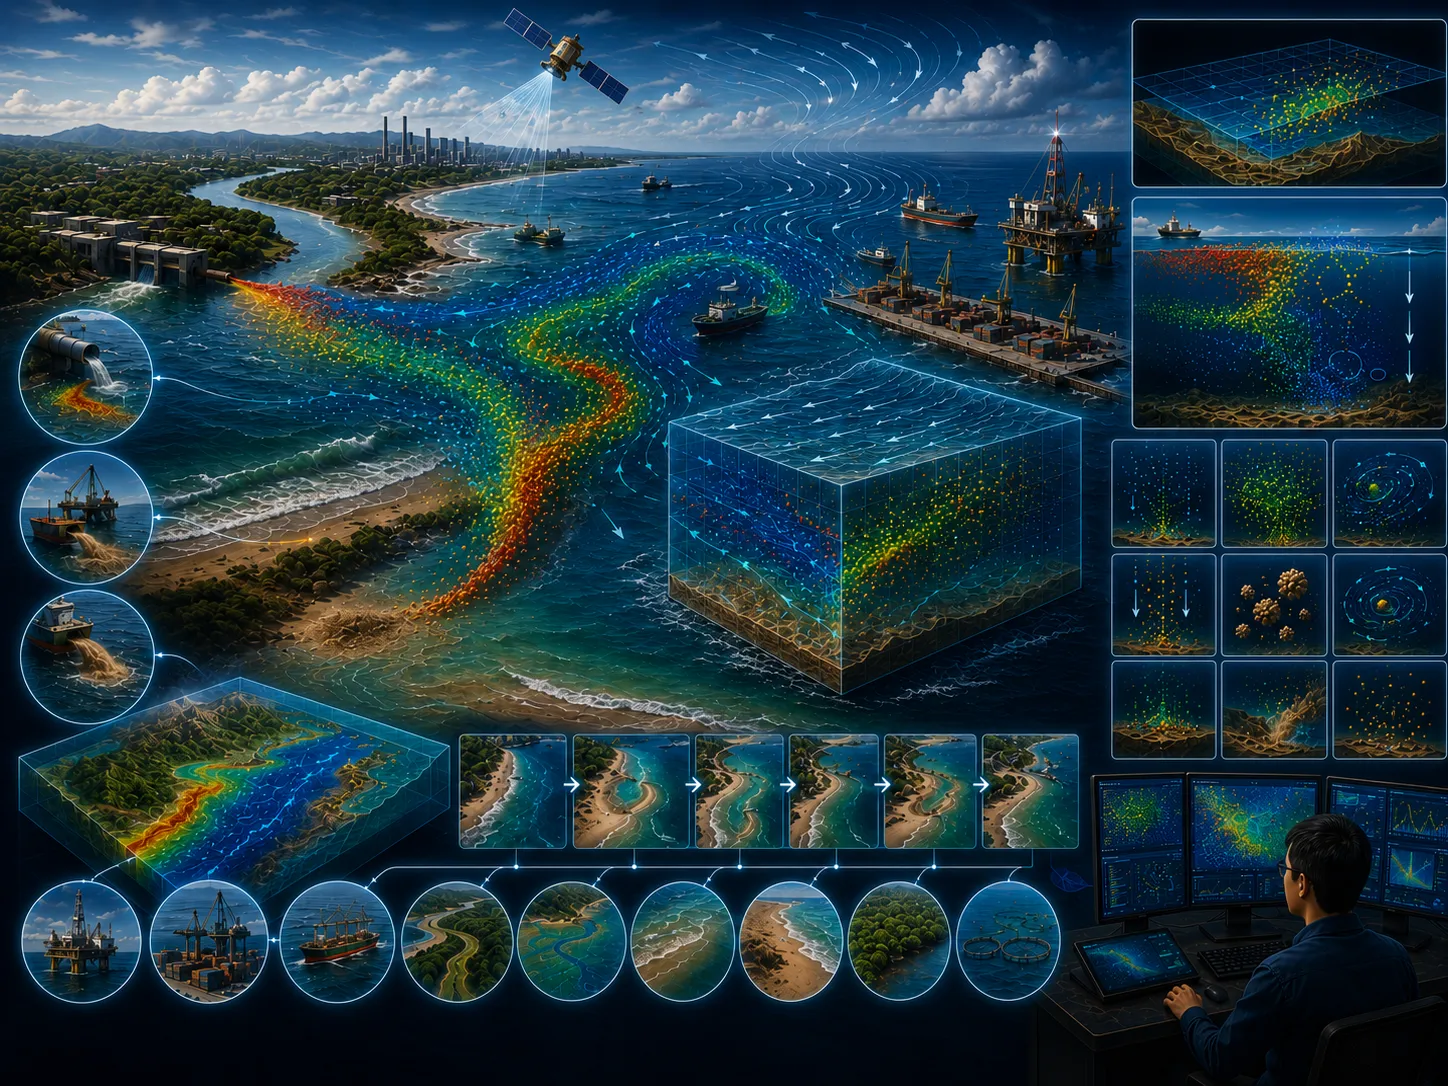
This aspect is assessed to clarify its implications for parabolic mild slope wave model.
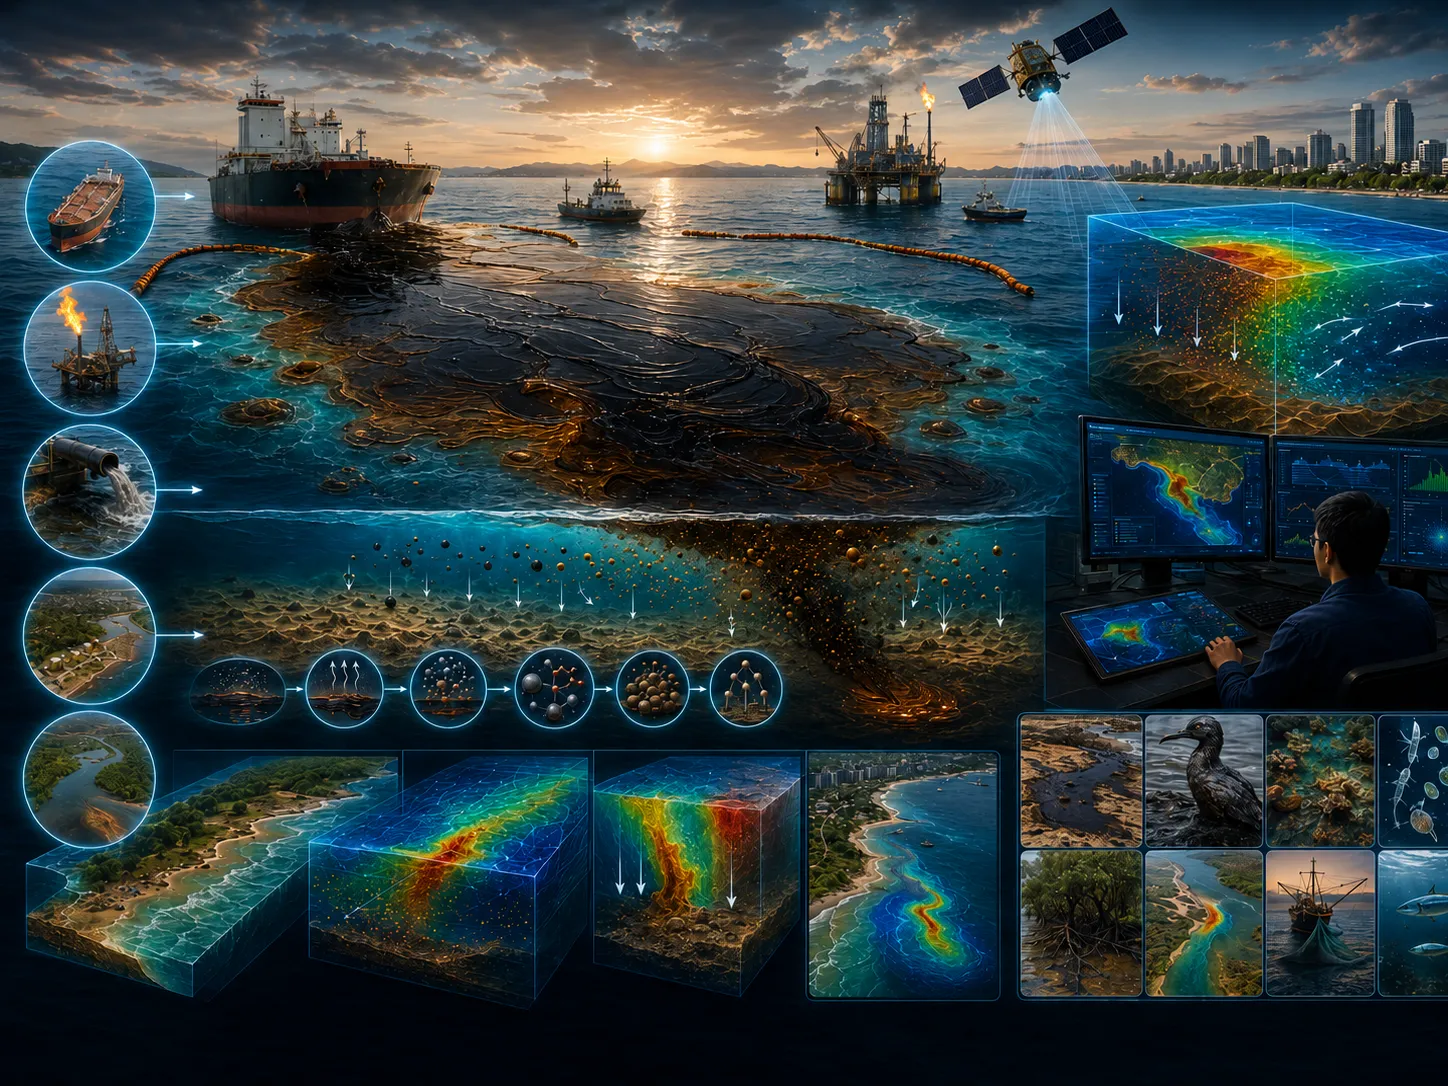
This aspect is assessed to clarify its implications for parabolic mild slope wave model.
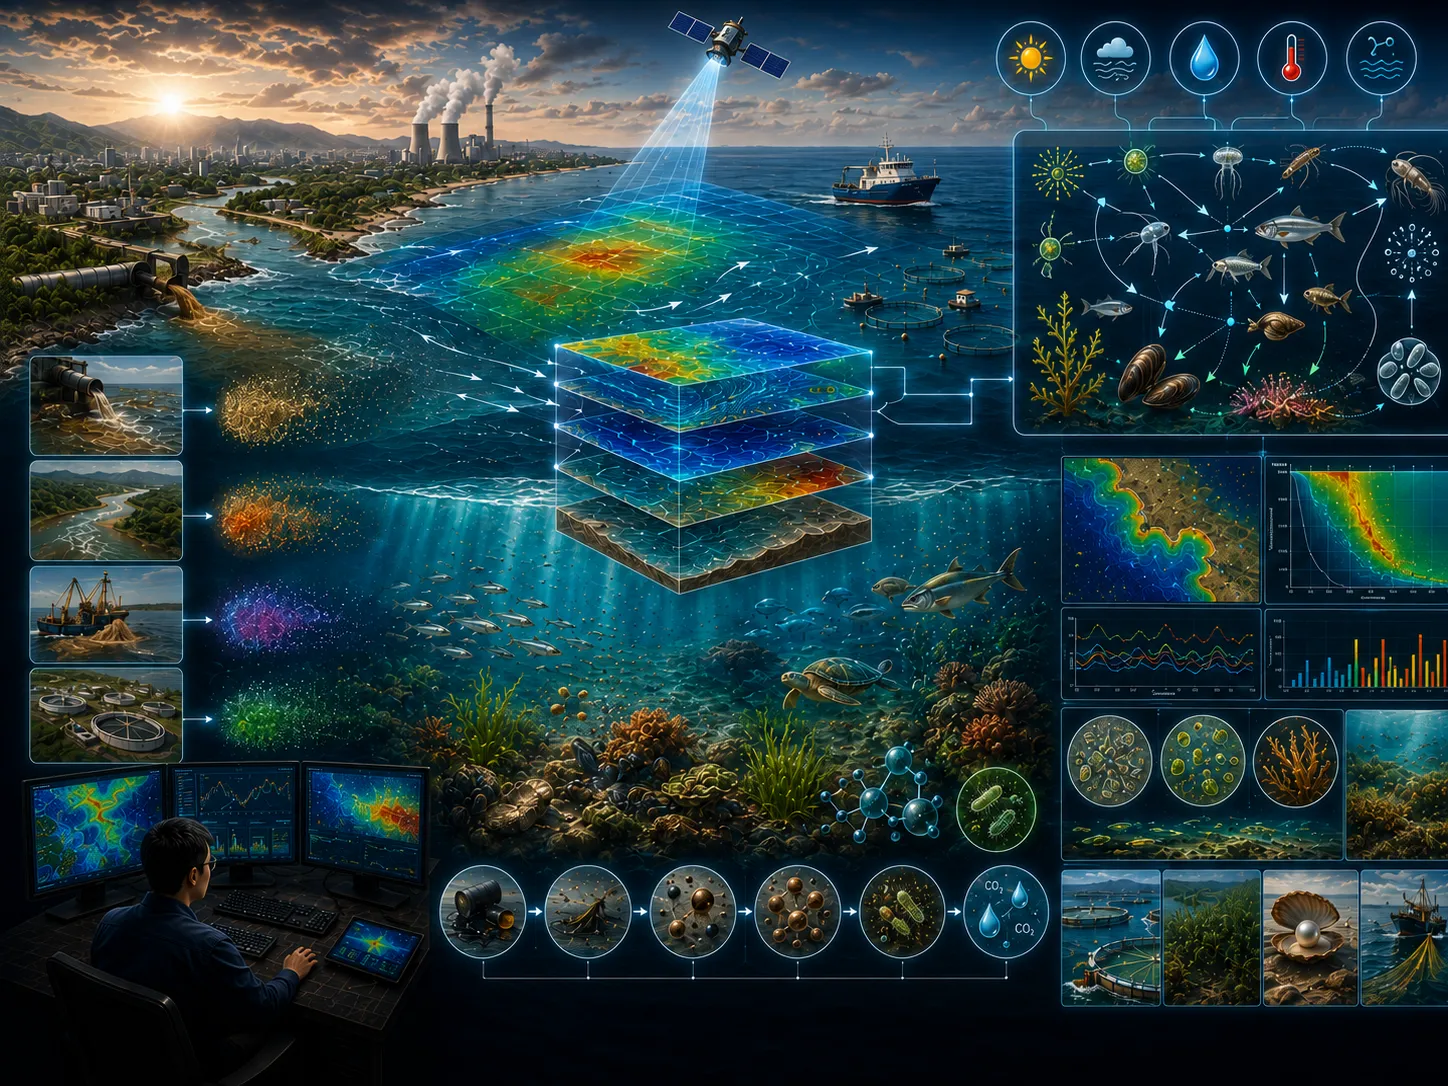
Field surveys, in-situ measurements, laboratory results, historical records, and operating information as required.
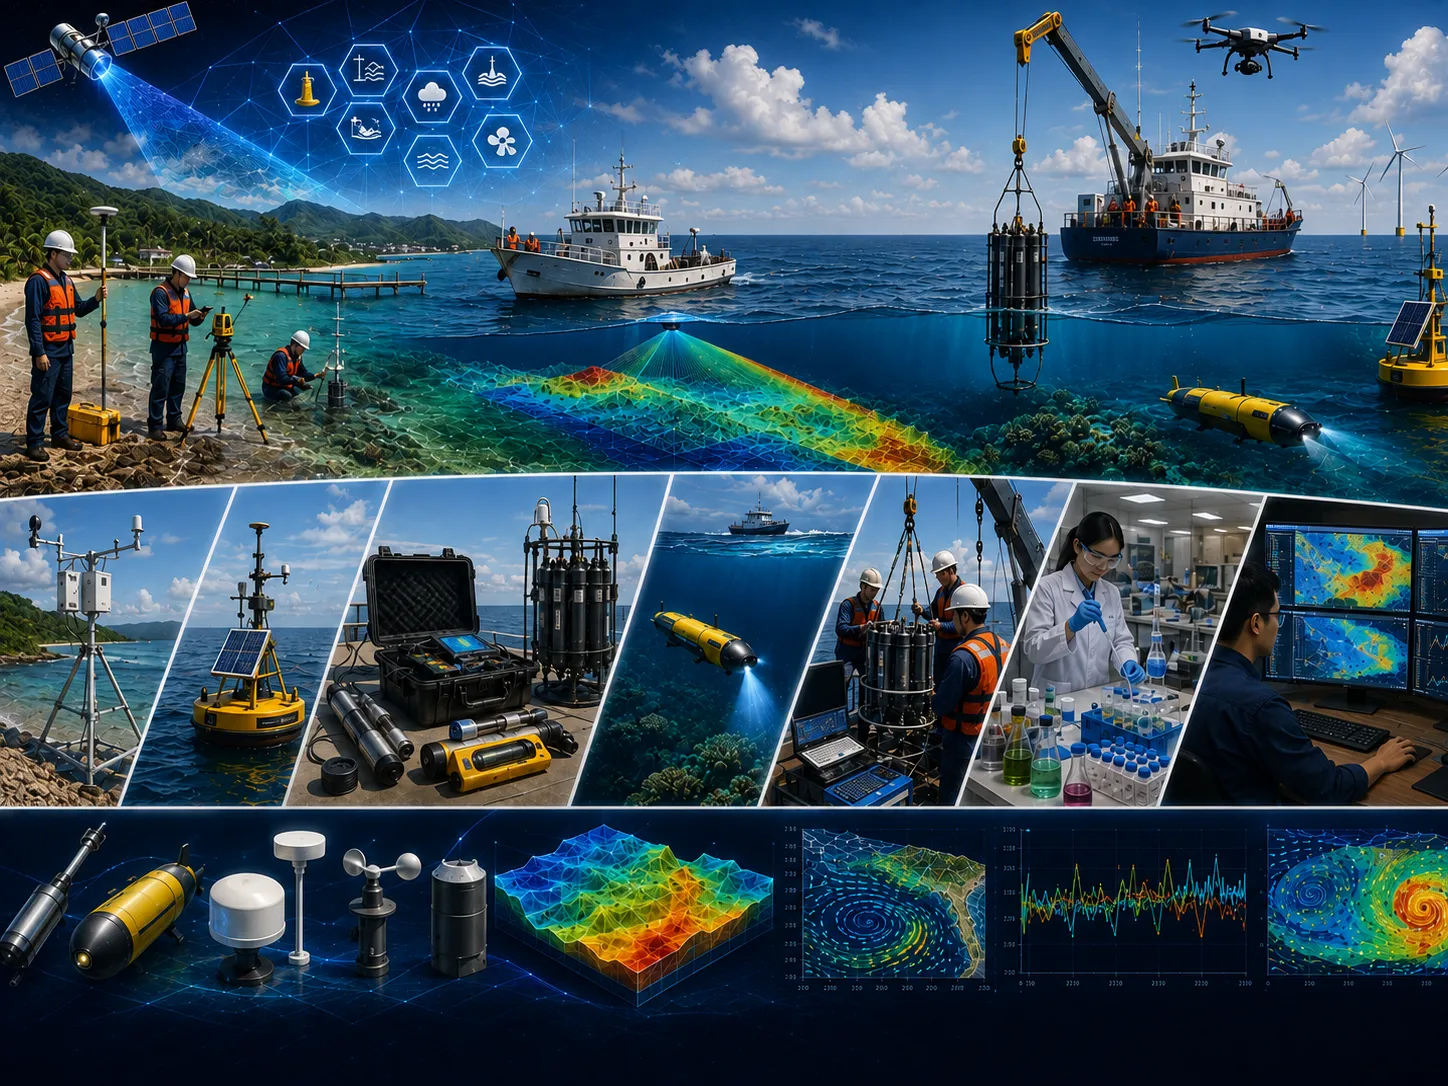
Satellite imagery, mapping, spatial analysis, temporal change, and integration of multiple data sources.

Model setup, calibration, validation, existing–planned–extreme scenarios, and sensitivity analysis.
Metadata, quality controls, assumptions, limitations, data versions, and processing lineage are documented.
Objectives, study area, available data, additional needs, initial risks, and recommended level of detail.
Quality-controlled data, thematic maps, time series, indicators, and comparable visualizations.
Comparison of existing conditions, alternatives, extremes, sensitivities, consequences, and mitigation options.
Methods, results, limitations, recommendations, action priorities, and stakeholder presentation materials.
Assumptions, data, variability, and limitations are stated so decision risk is not hidden.
Alternative locations, designs, operations, or policies are assessed using consistent indicators.
Data needs and analysis depth are proportionate to risk so resources are used efficiently.
Findings and recommendations are transparent for technical, management, regulatory, and partner review.
Objectives, users, location, project phase, problems, constraints, and the decision to support.
Methods, data, surveys, models, schedule, team, deliverables, review gates, and resource estimate.
Collection, inspection, harmonization, documentation, and data-sufficiency assessment.
Processing, modeling, validation, option comparison, sensitivity, and risk evaluation.
Maps, report, executive brief, presentation, supporting data, and follow-up plan.
The Parabolic Mild Slope Wave Model Module is a linear wave refraction–diffraction model based on a parabolic approximation of the elliptic mild-slope equation. This module simulates the effects of wave refraction and shoaling caused by depth variations, as well as wave energy dissipation due to bottom friction and wave breaking. It can also represent the effects of frequency spreading and directional spreading by applying the principle of linear superposition.
This wave module is based on equations derived from the parabolic approximation of the mild-slope equation. Several parabolic approaches can be applied, ranging from a simple approximation for small wave angles to more advanced formulations for larger wave angles, up to approximately 60°. The parabolic equation is solved using a Crank–Nicolson finite difference scheme.
The module is well suited for studying wave disturbances in open coastal waters, including open coastlines with coastal structures such as breakwaters, wave barriers, and similar structures. It is most appropriate when reflected waves from coastal structures can be neglected and when wave diffraction mainly occurs in the principal wave direction. This module is particularly important for analyzing wave conditions, including wave height, wave period, and wave direction, as well as wave-induced currents. These parameters are essential for sediment transport studies and for assessing erosion and deposition patterns in coastal zones.
However, this module is not fully suitable for detailed studies of wave refraction and diffraction in complex harbor areas with many coastal structures. It may still be used to support assessments of the strength and stability of harbor structures, but it is not intended to evaluate the effects of wave refraction and diffraction on vessel stability or ship maneuvering inside harbors.
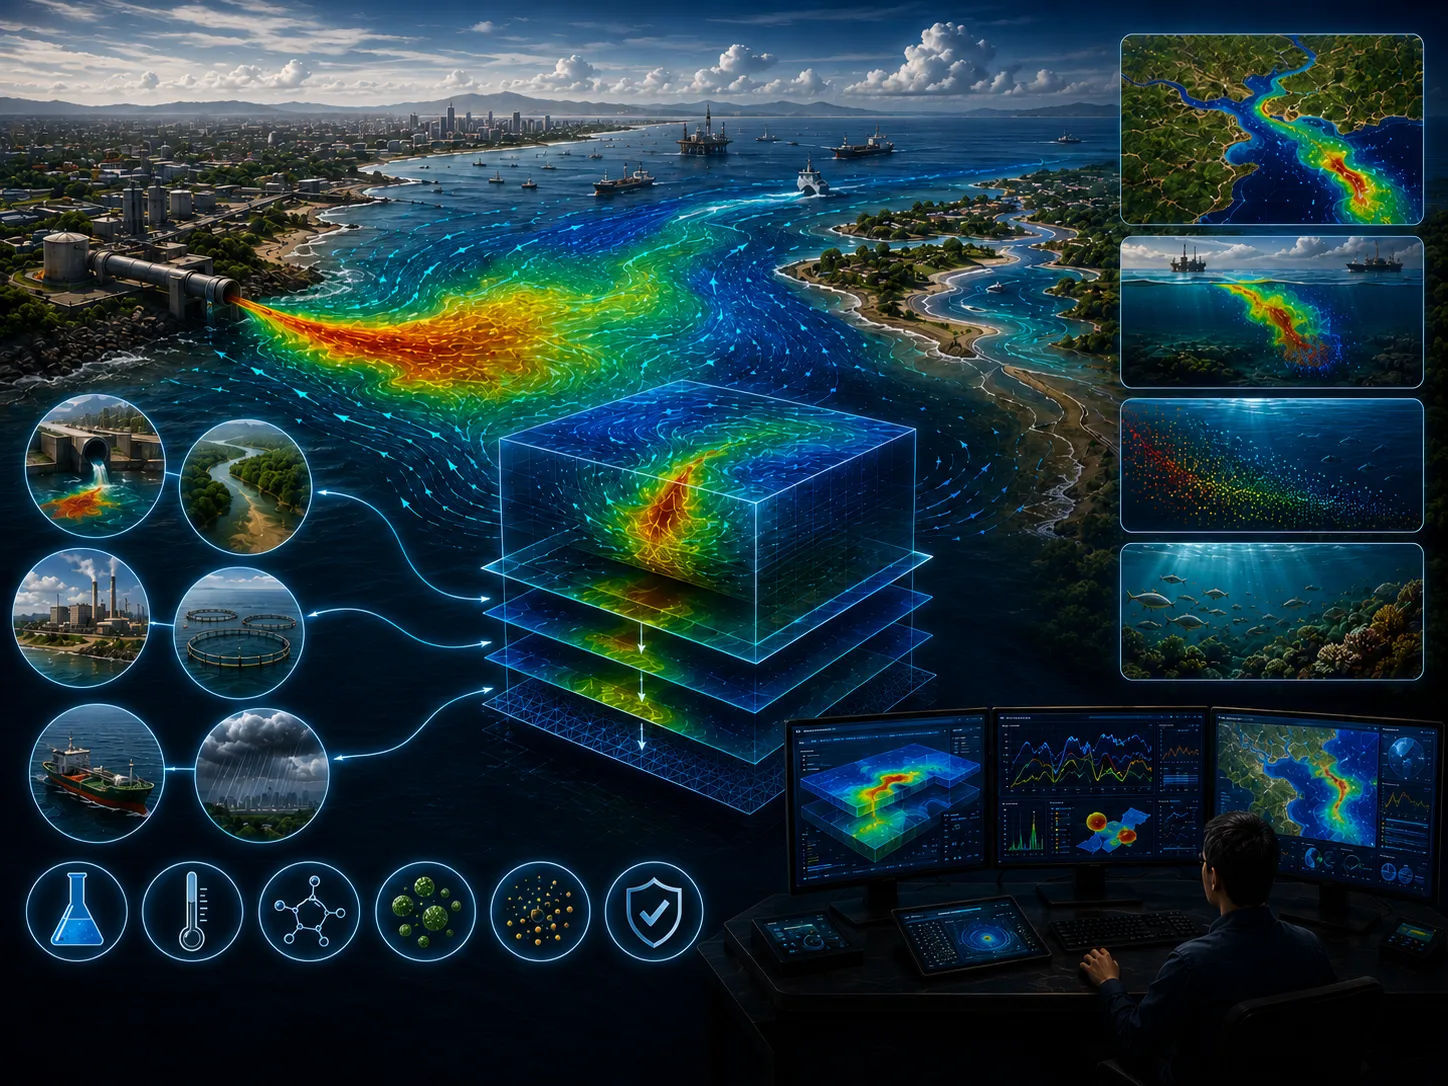
The Hydrodynamic Module simulates variations in water levels and current circulation generated by multiple driving forces, including tides, wind, river discharge, and wave-induced radiation stress…
Learn more →The Advection–Dispersion Module simulates the transport, dispersion, and decay of dissolved or suspended substances and materials within aquatic environments.
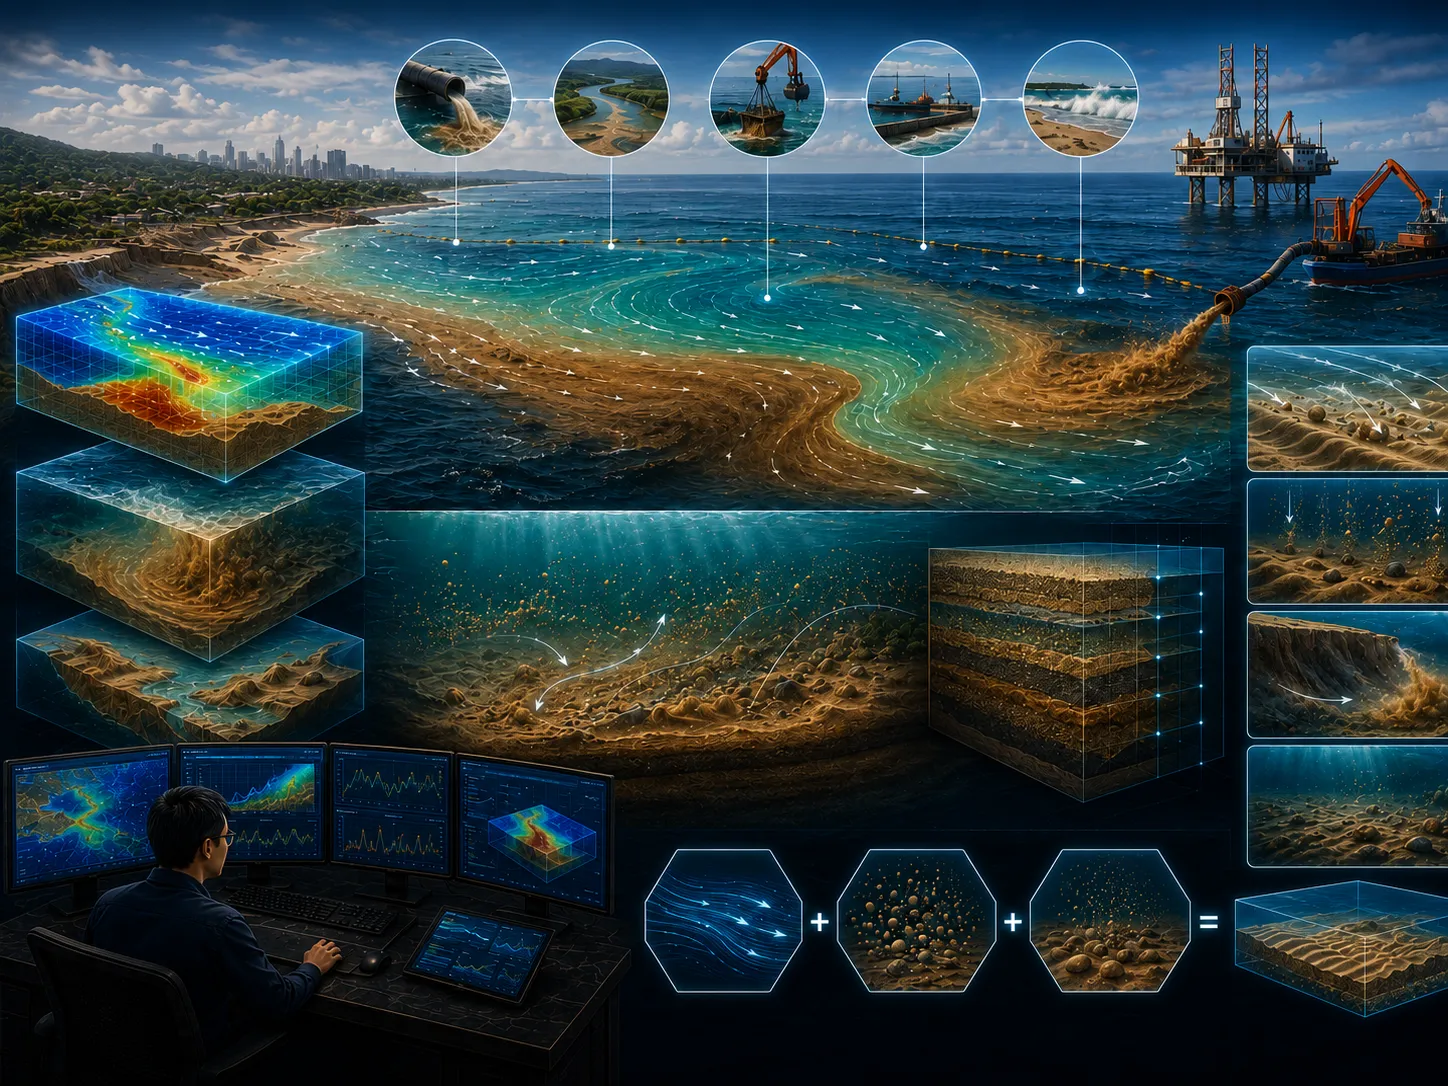
Learn more →The Bottom Sediment Transport Module simulates the erosion, transport, deposition, and accumulation of bottom sediments.
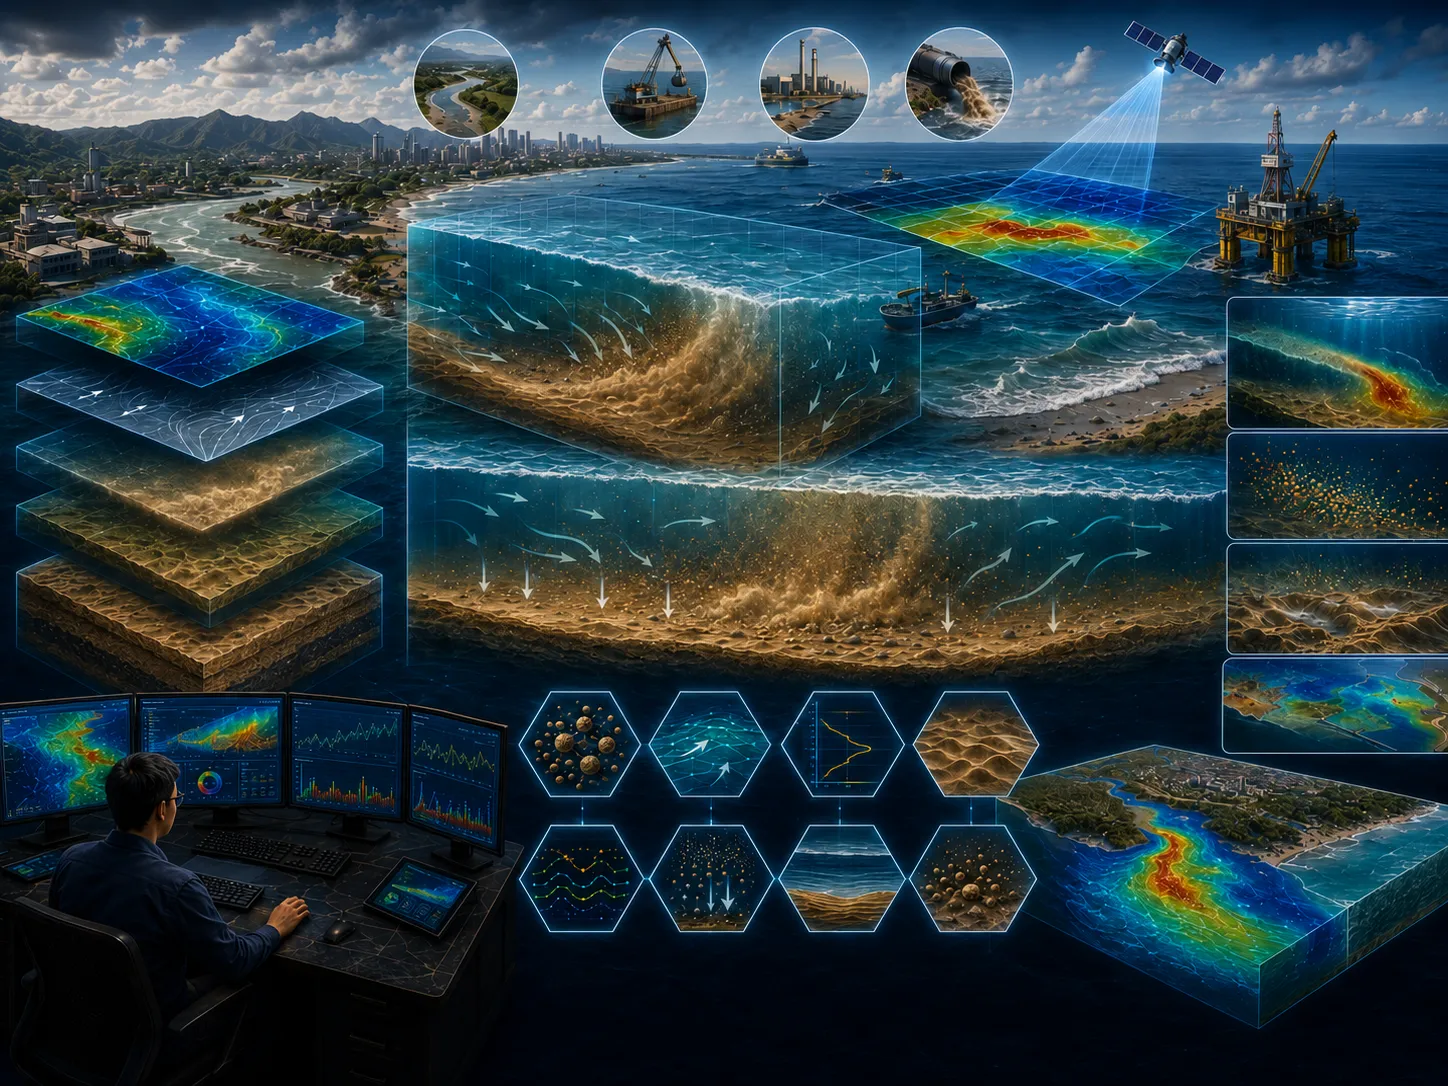
Learn more →The Water Column Sediment Transport Module simulates the transport, dispersion, settling, erosion, and deposition of suspended sediments throughout the water column.
Learn more →The Coastal Morphology Module is an integrated numerical modeling system that combines wave, hydrodynamic, and sediment transport modules to simulate the time-dependent evolution of coastal morphology.
Learn more →The Particle Tracking Module is one of the most efficient tools for studying the distribution of dissolved and suspended particles in aquatic environments.
Learn more →The CORZ team will review the objective, scope, data availability, risk level, schedule, and required outputs to prepare a proportionate approach.
Share the location, objectives, key challenges, available data, and expected outputs. The CORZ team will help define a proportionate technical approach.