CONTEXTField conditions and systems being assessed
Enter at least two characters.
Indonesia's marine aquaculture industry has experienced periods of remarkable growth as well as rapid decline.
This page includes a one-page leaflet that can be opened in a full-image popup. It helps present the core CORZ service clearly and convincingly during project discussions, executive briefings, and decision-support meetings.
With a more proportional balance between visuals and text, the page feels brighter and more energetic while still keeping the important technical context visible and easy to understand.
Use this leaflet as a concise visual entry point before moving into the more detailed technical explanation.
Clarity before a decision is made
Indonesia's marine aquaculture industry has experienced periods of remarkable growth as well as rapid decline.
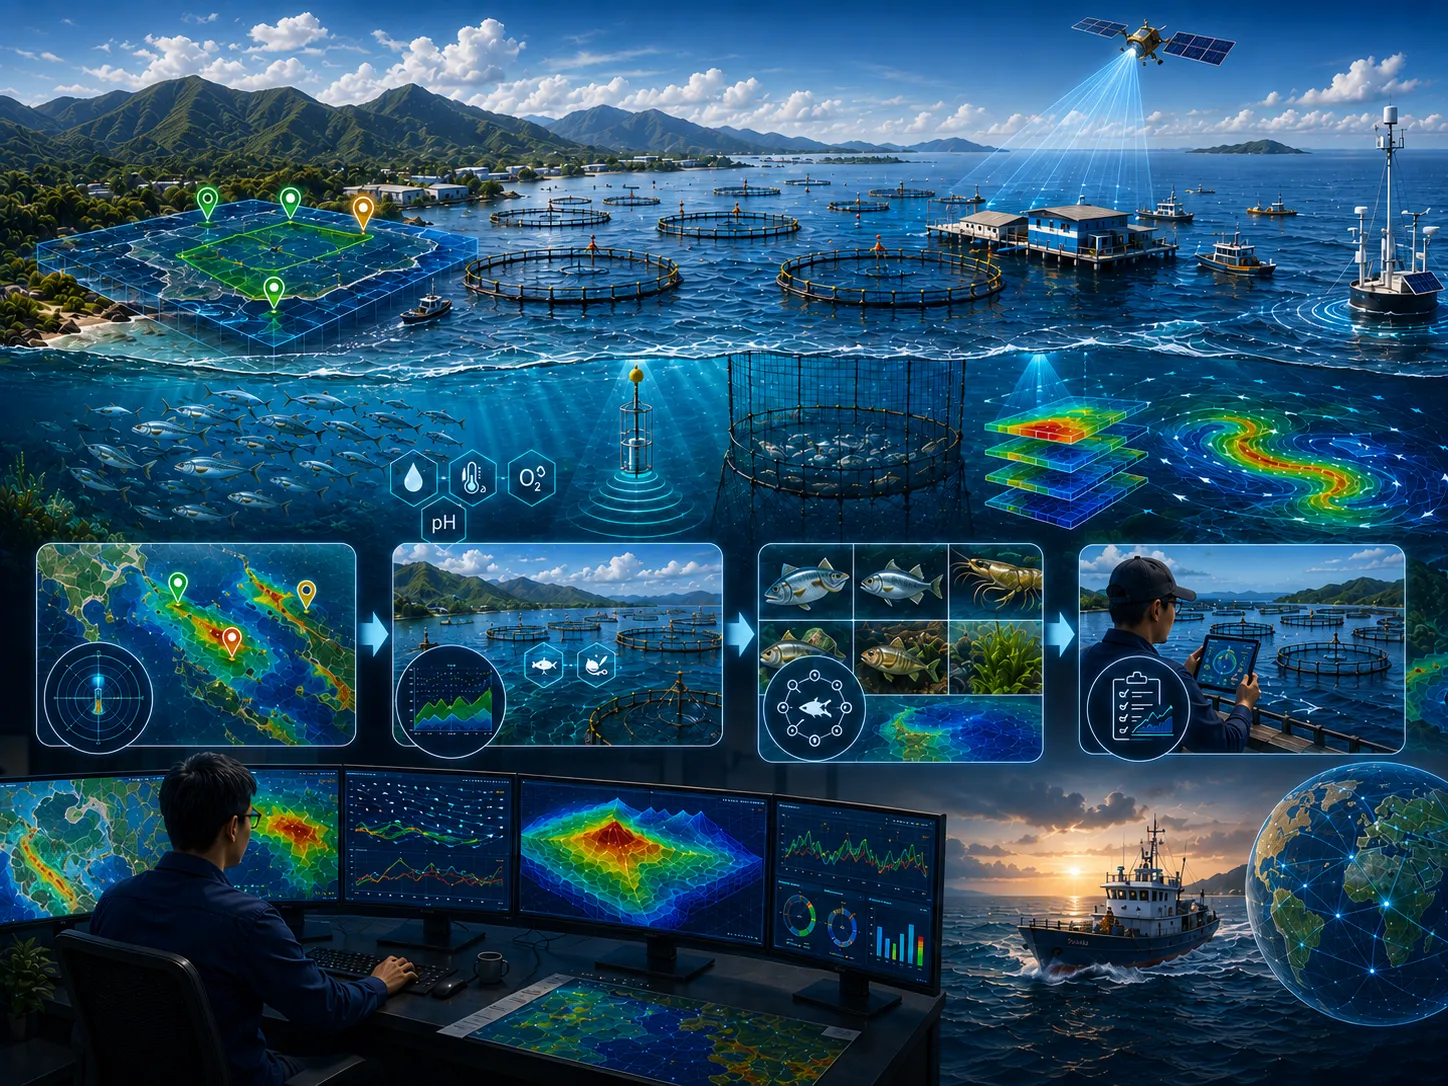
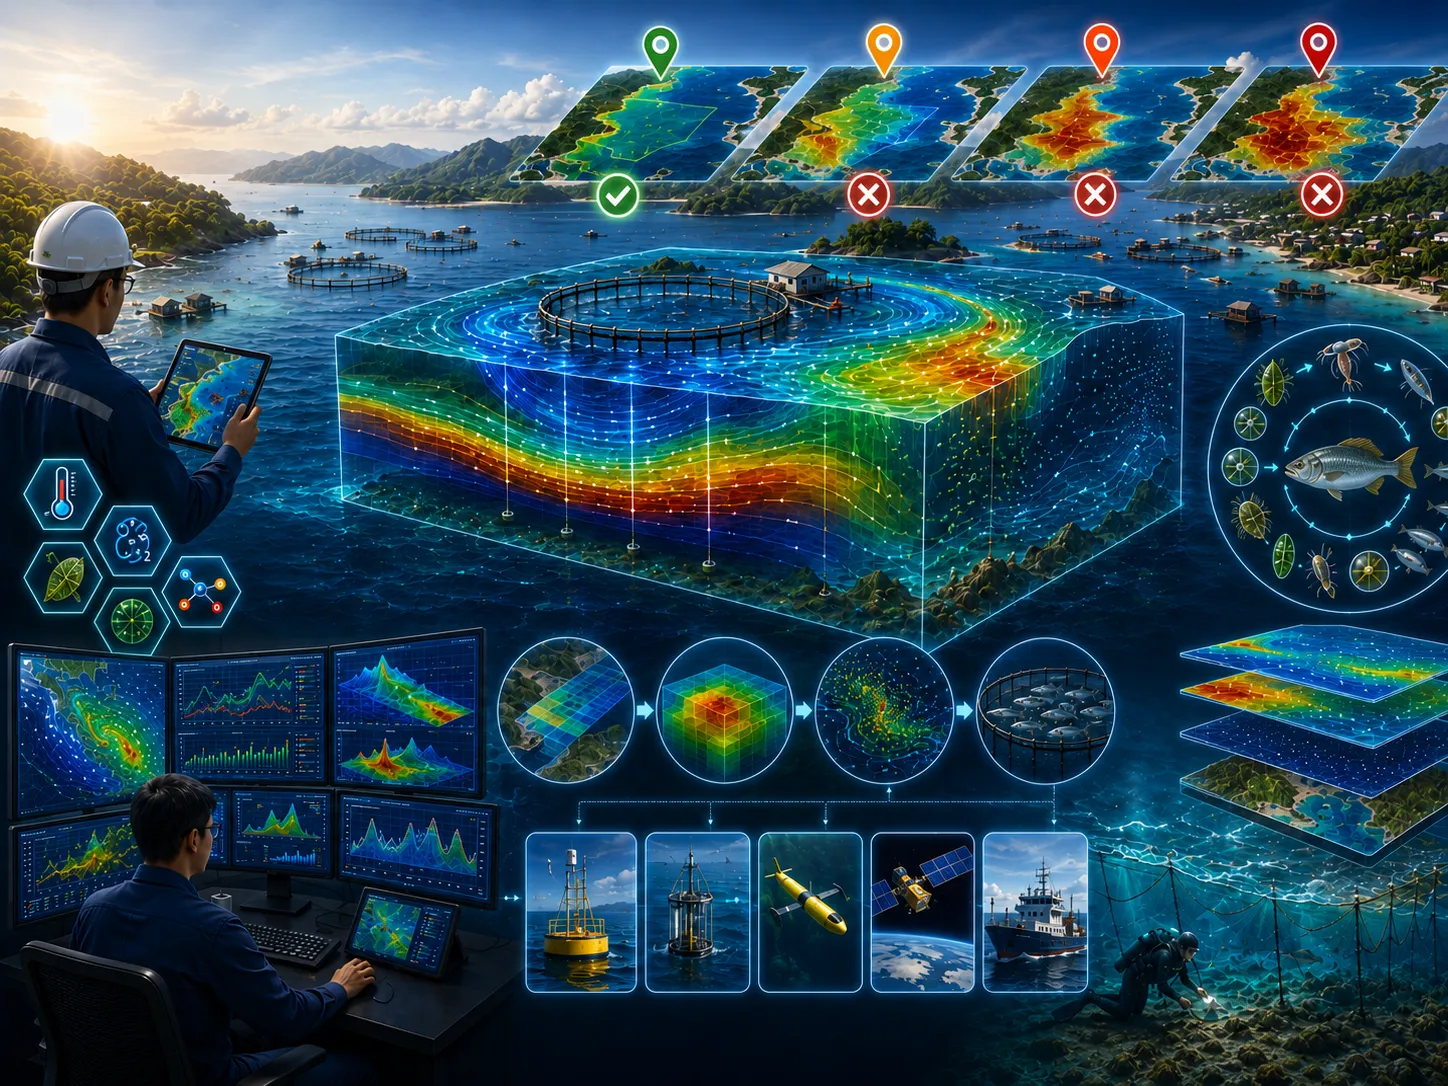
The primary challenges facing marine aquaculture include selecting unsuitable farming locations, inadequate environmental carrying capacity, poor selection of cultured species for local environmental conditions, and ineffective farm management strategies. These challenges can be significantly reduced when advanced numerical modeling is incorporated throughout the entire project lifecycle—from site selection and infrastructure planning to daily farm operation and long-term management.
Define the approach, priorities, and actions for marine aquaculture management using traceable evidence.
Environmental impact, design failure, operational disruption, uncontrolled cost, and weak assumptions.
Comparable options, quantified risk, and implementable recommendations.
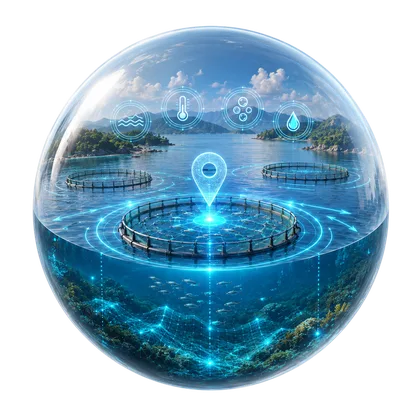
Naturally, each fish species occupies a habitat that best meets its biological and ecological requirements.
Learn more →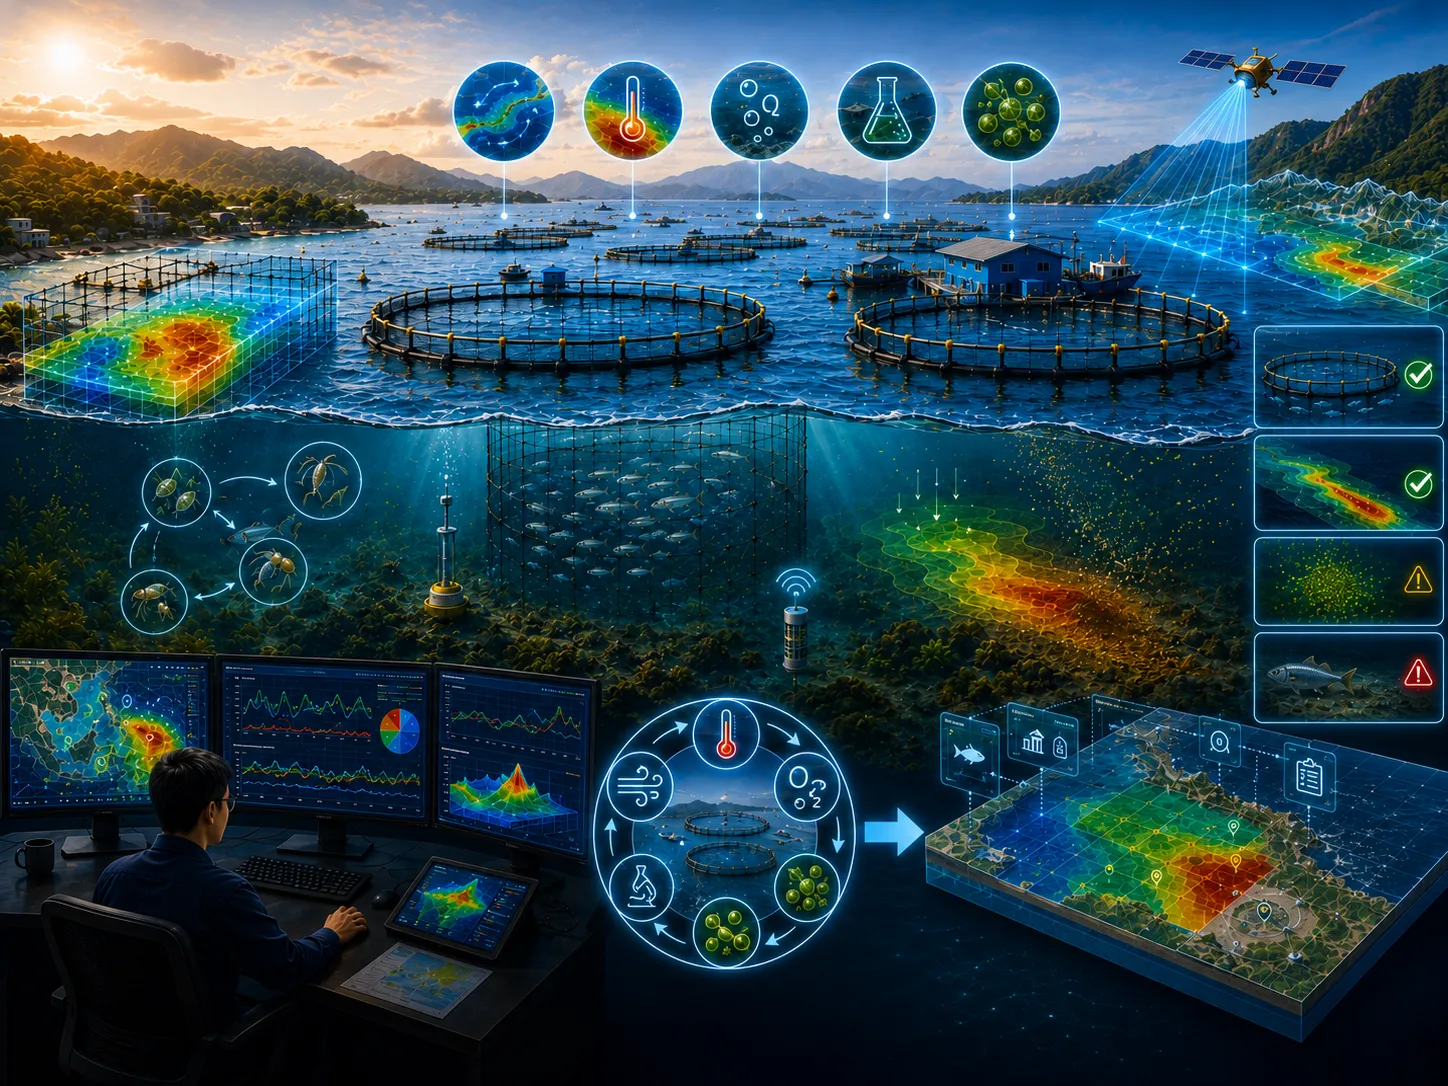
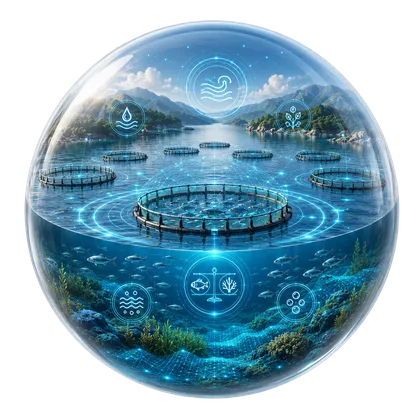
In coastal spatial planning, designated marine areas are often allocated for aquaculture development, or large-scale aquaculture projects are proposed by the fisheries industry.
Learn more →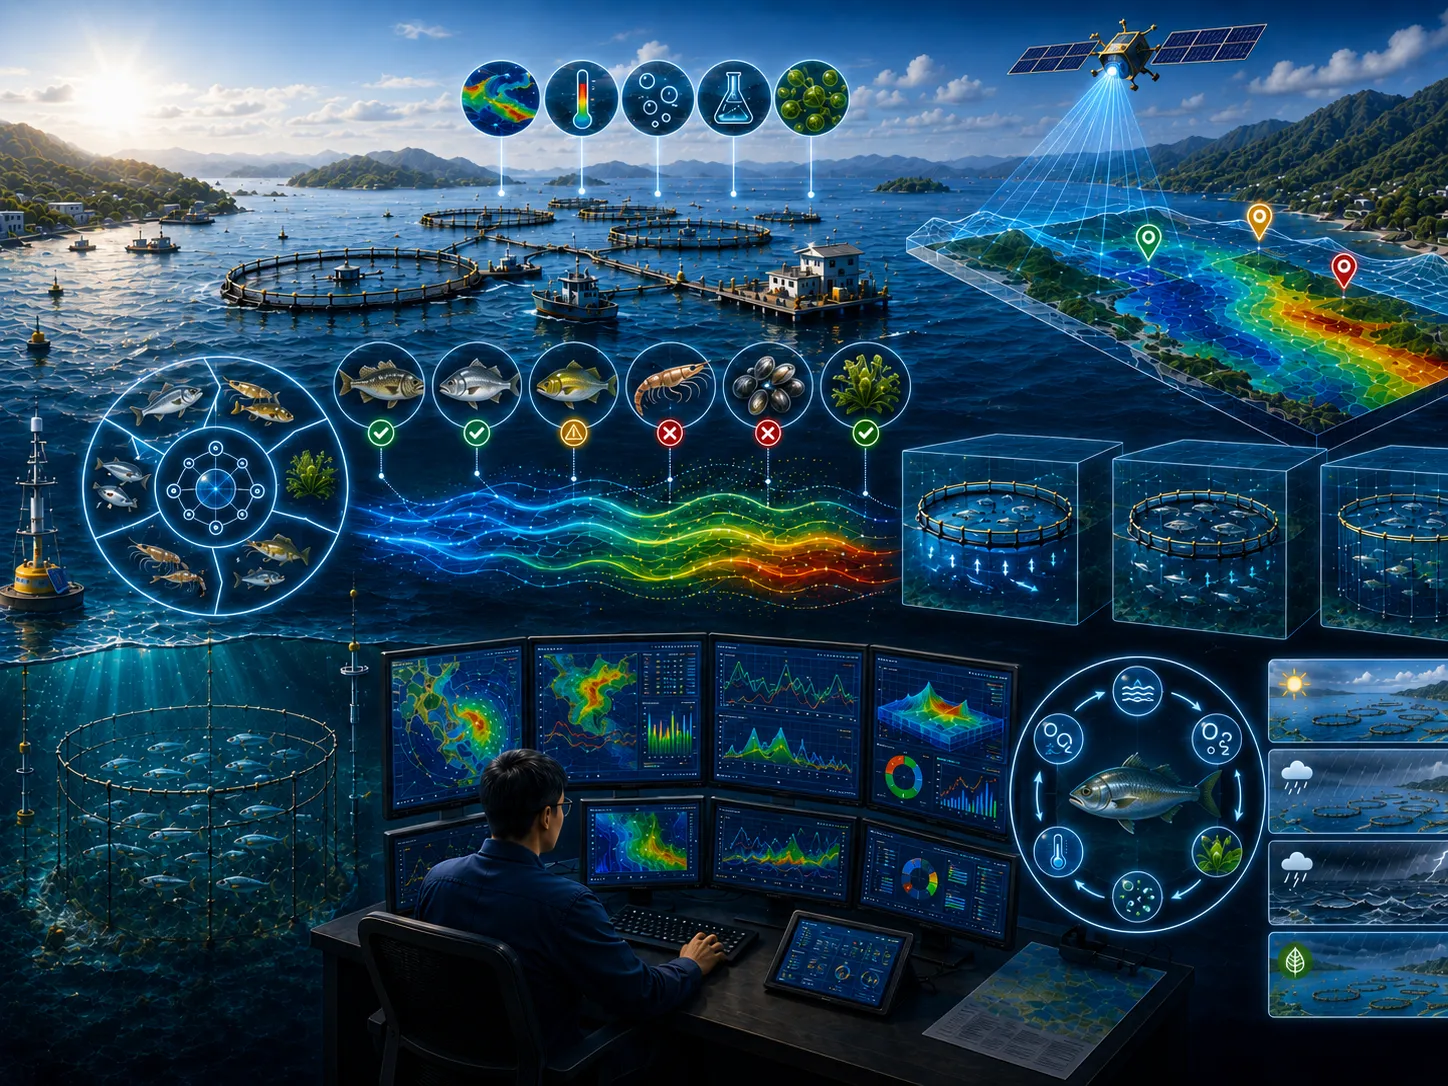
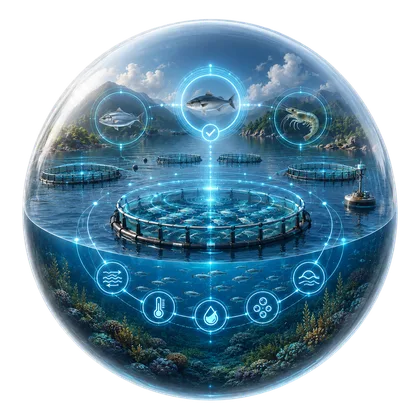
Every aquatic environment has unique characteristics that distinguish it from other water bodies.
Learn more →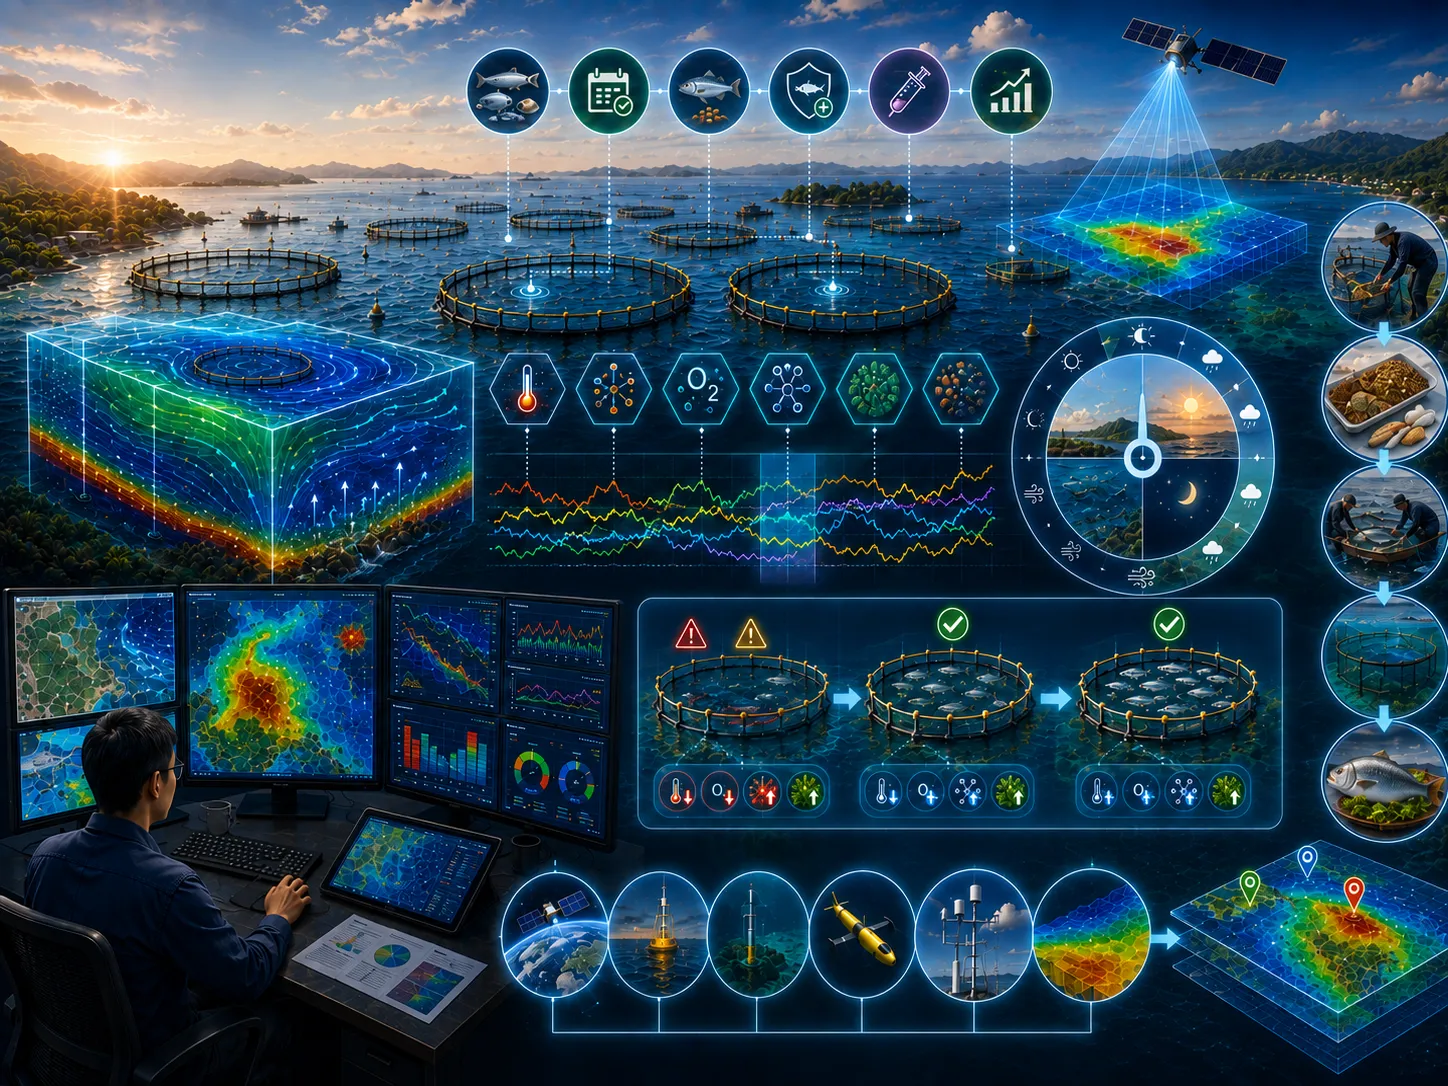
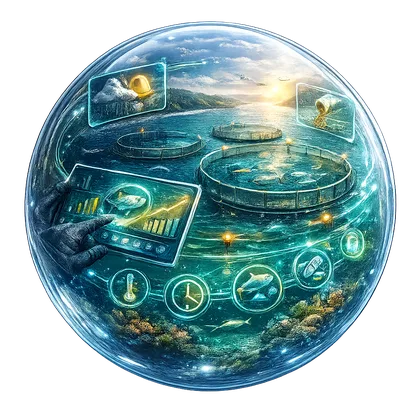
Environmental conditions at marine aquaculture sites vary continuously over time, directly influencing the growth, health, and productivity of cultured species.
Learn more →Field surveys, in-situ measurements, laboratory results, historical records, and operating information as required.
Satellite imagery, mapping, spatial analysis, temporal change, and integration of multiple data sources.
Model setup, calibration, validation, existing–planned–extreme scenarios, and sensitivity analysis.
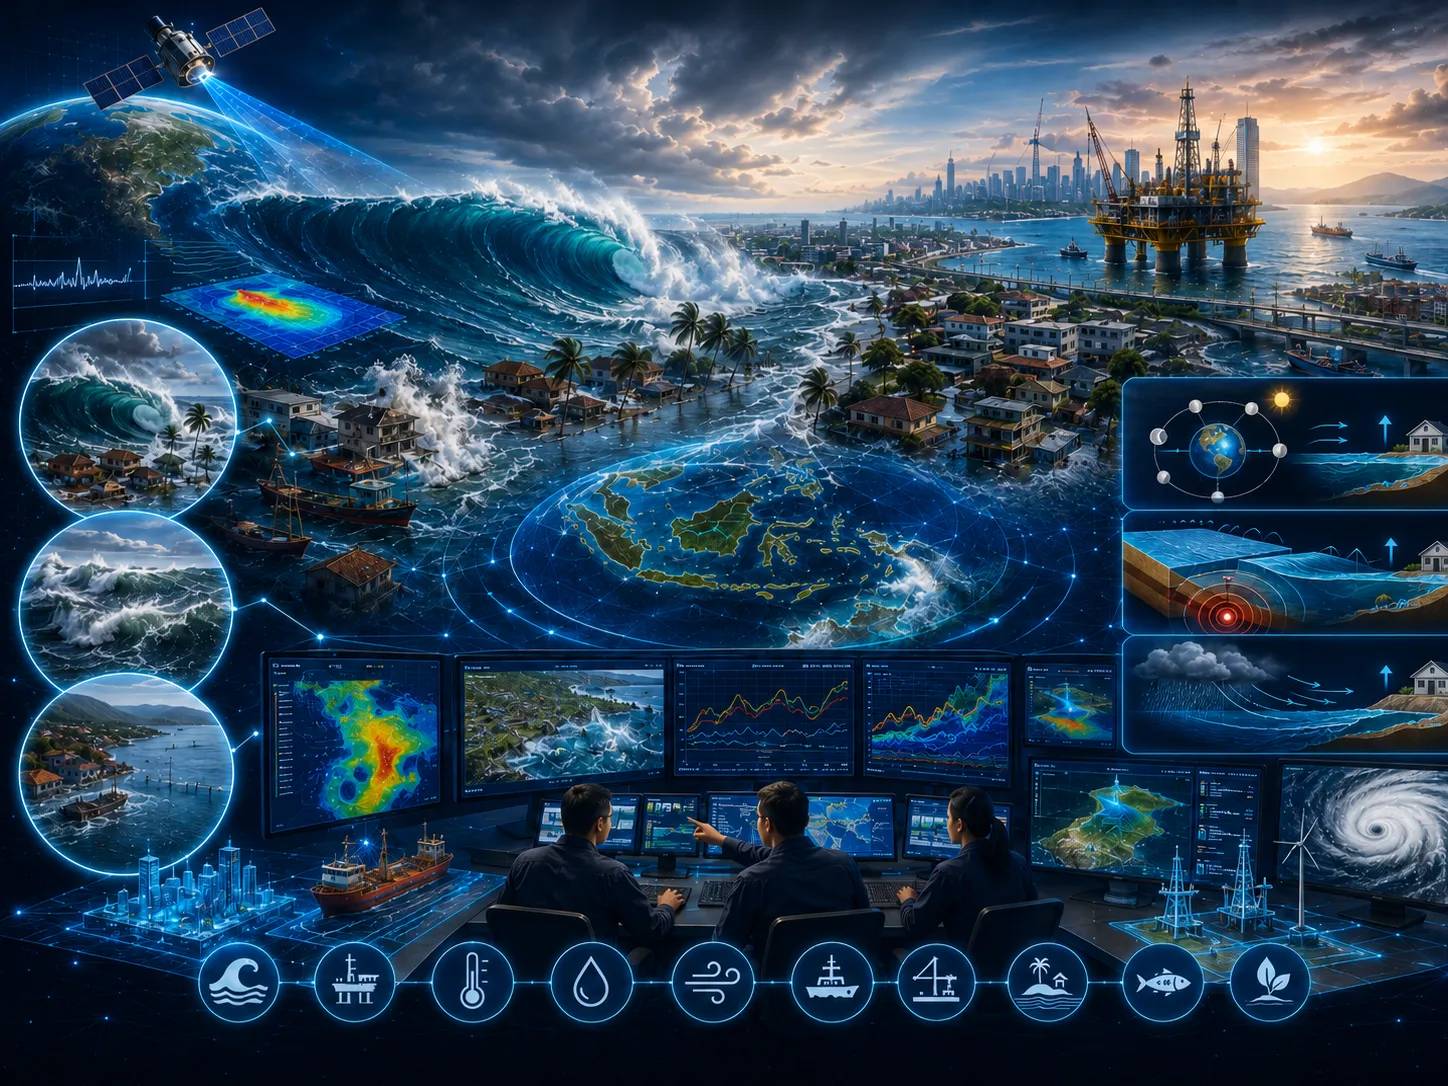
Metadata, quality controls, assumptions, limitations, data versions, and processing lineage are documented.
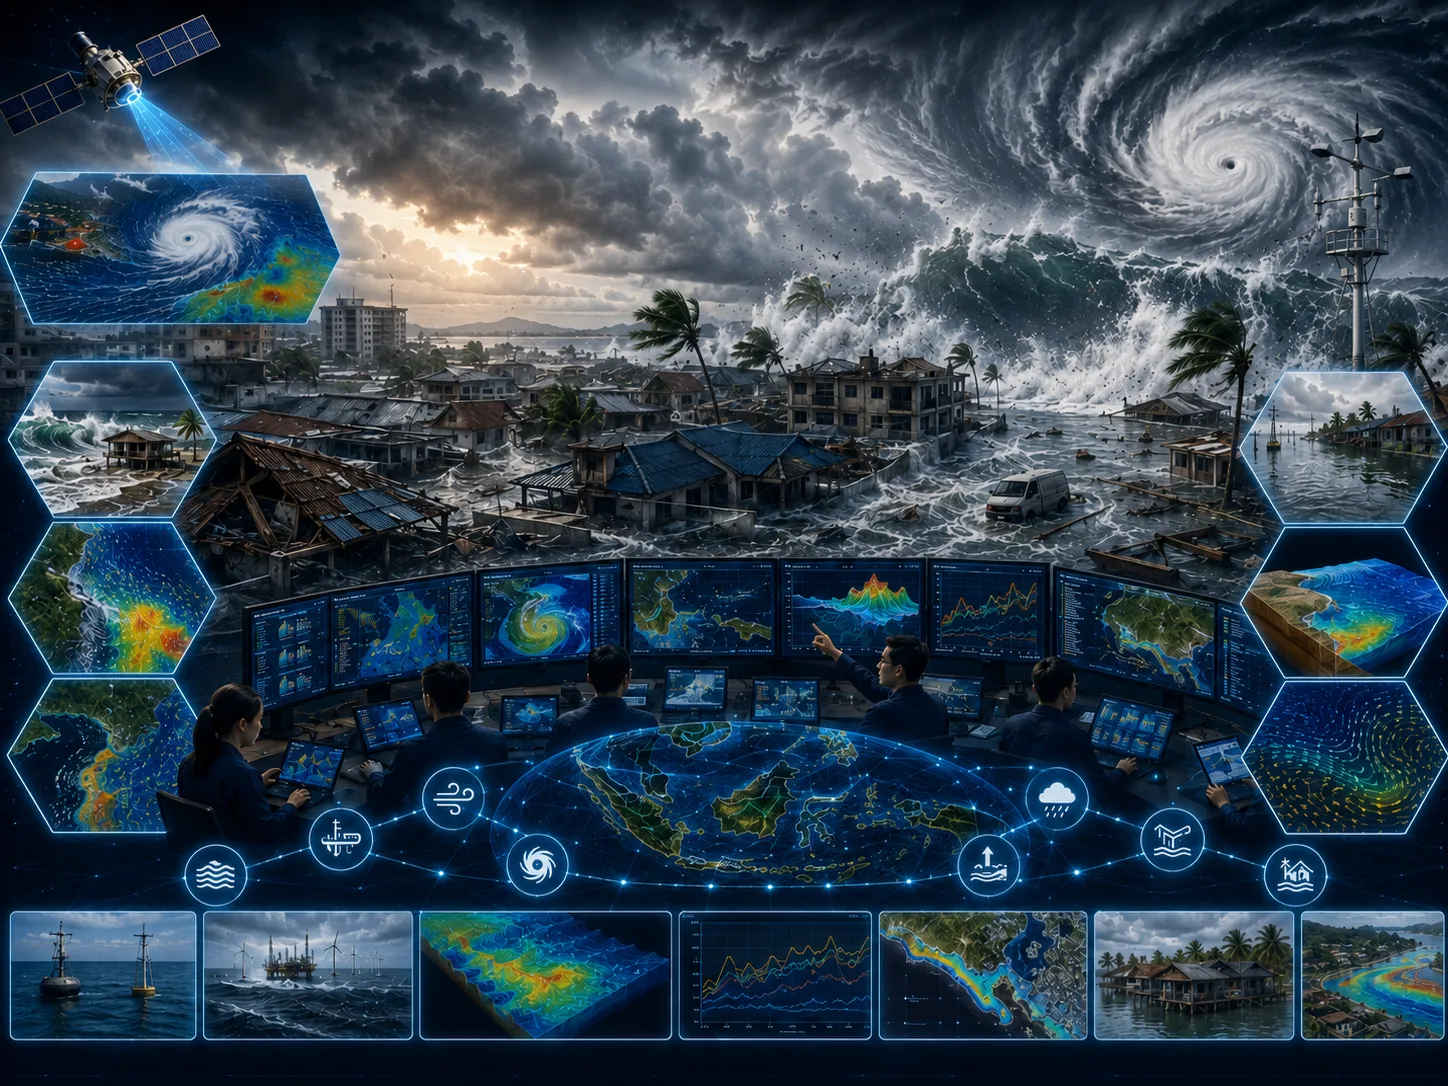
Objectives, study area, available data, additional needs, initial risks, and recommended level of detail.
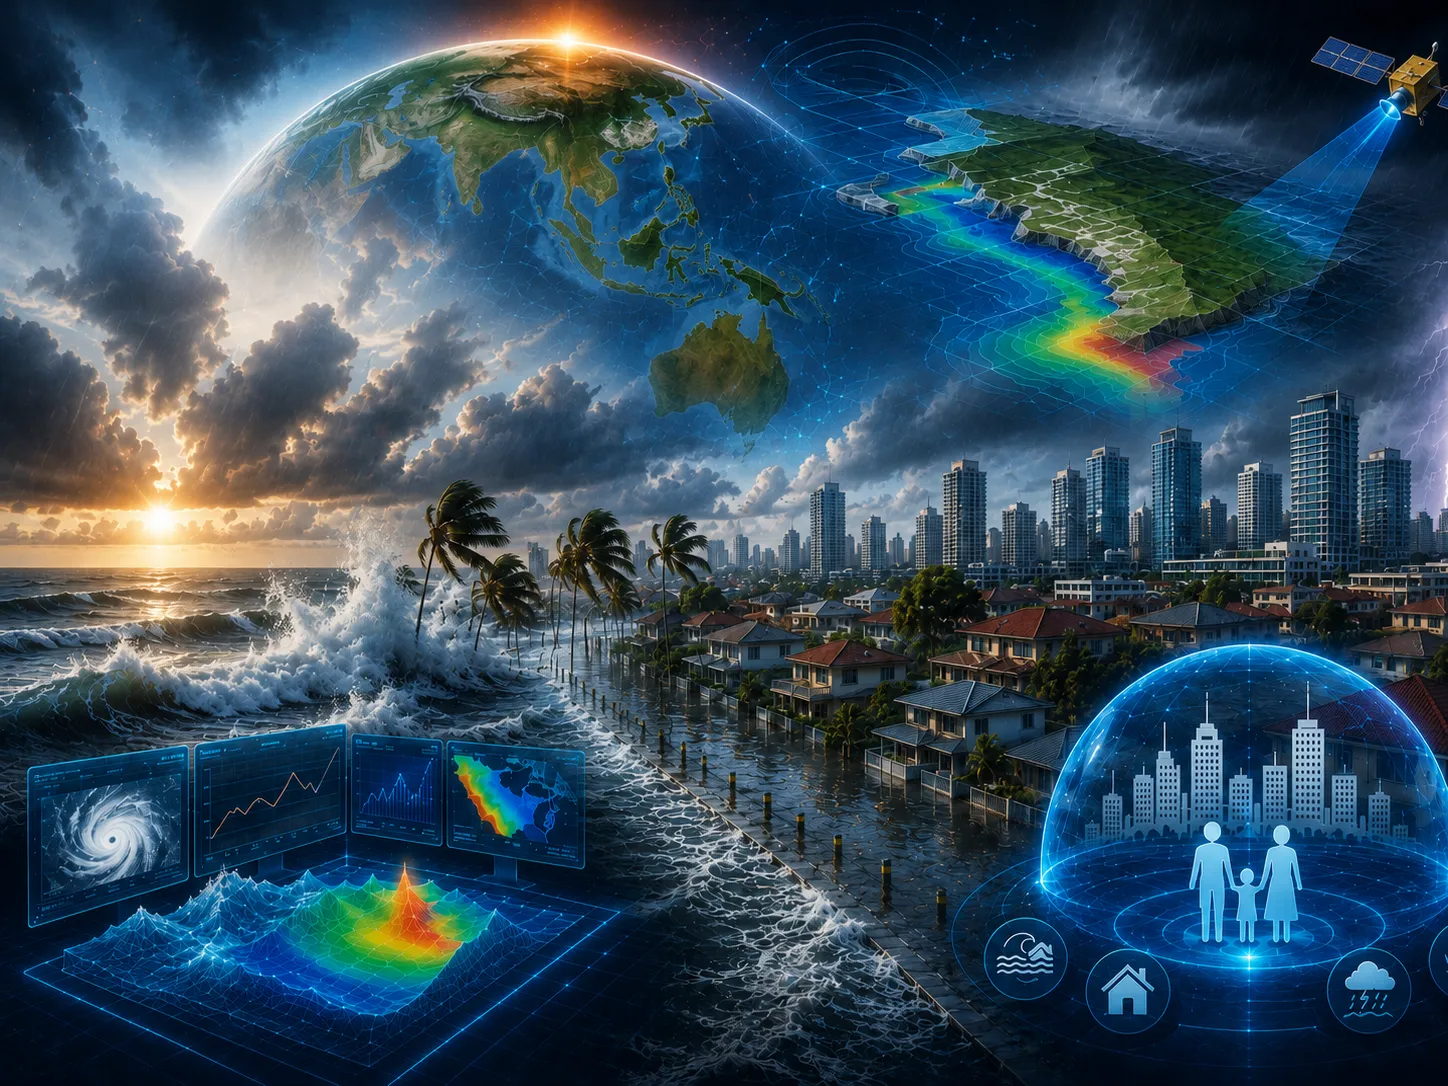
Quality-controlled data, thematic maps, time series, indicators, and comparable visualizations.
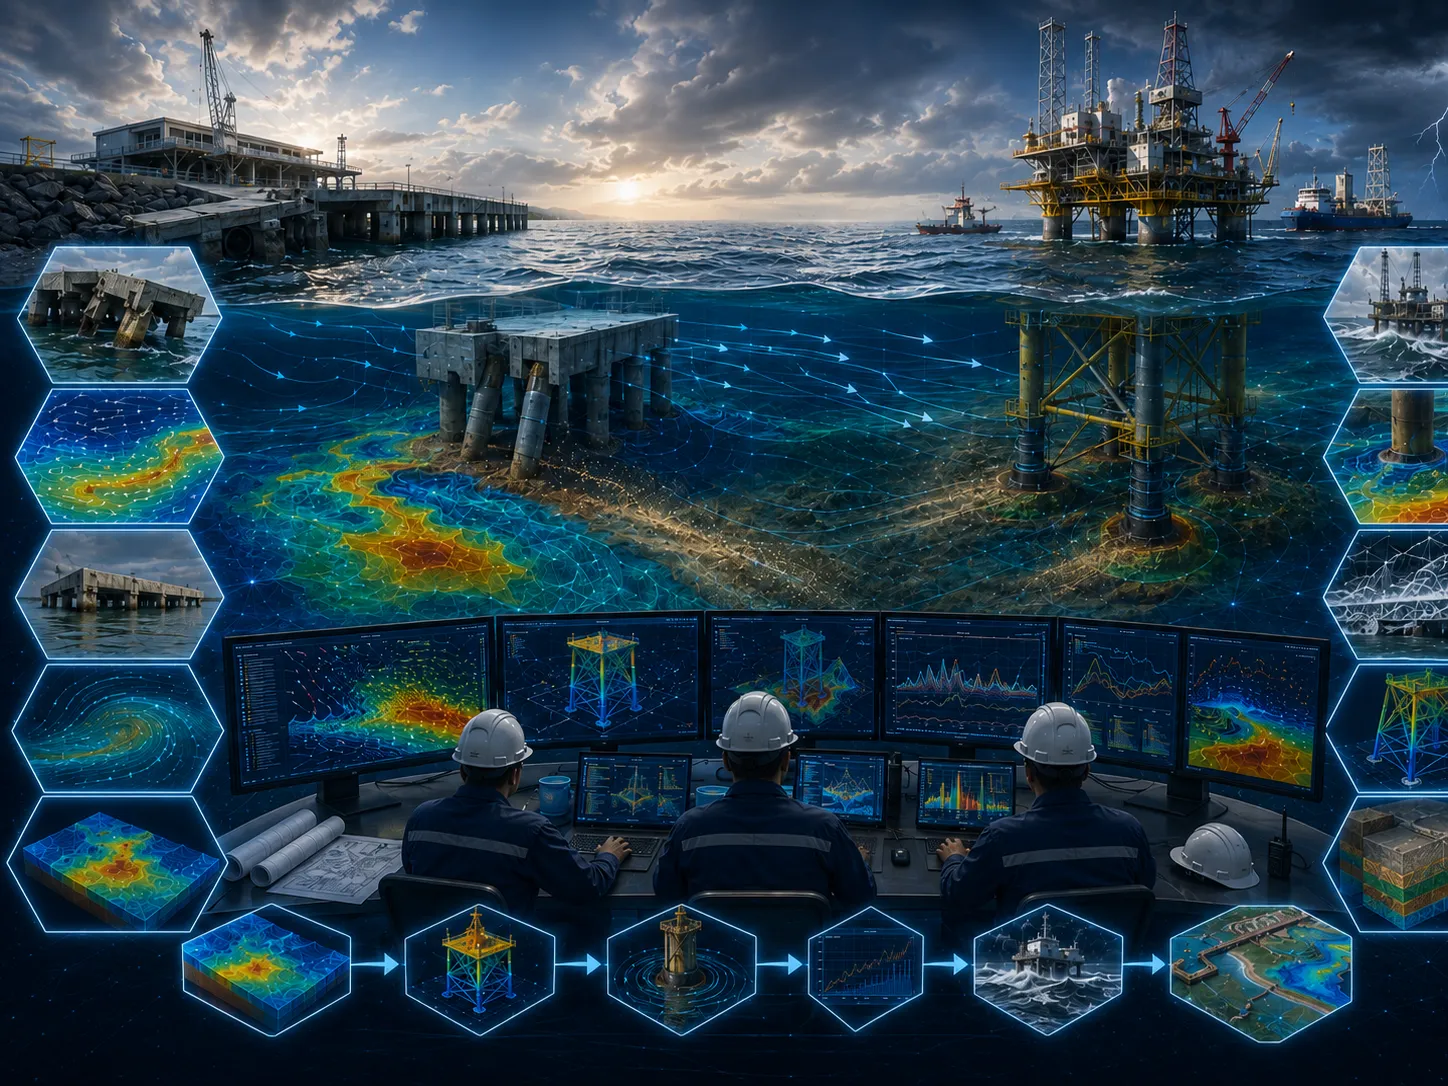
Comparison of existing conditions, alternatives, extremes, sensitivities, consequences, and mitigation options.
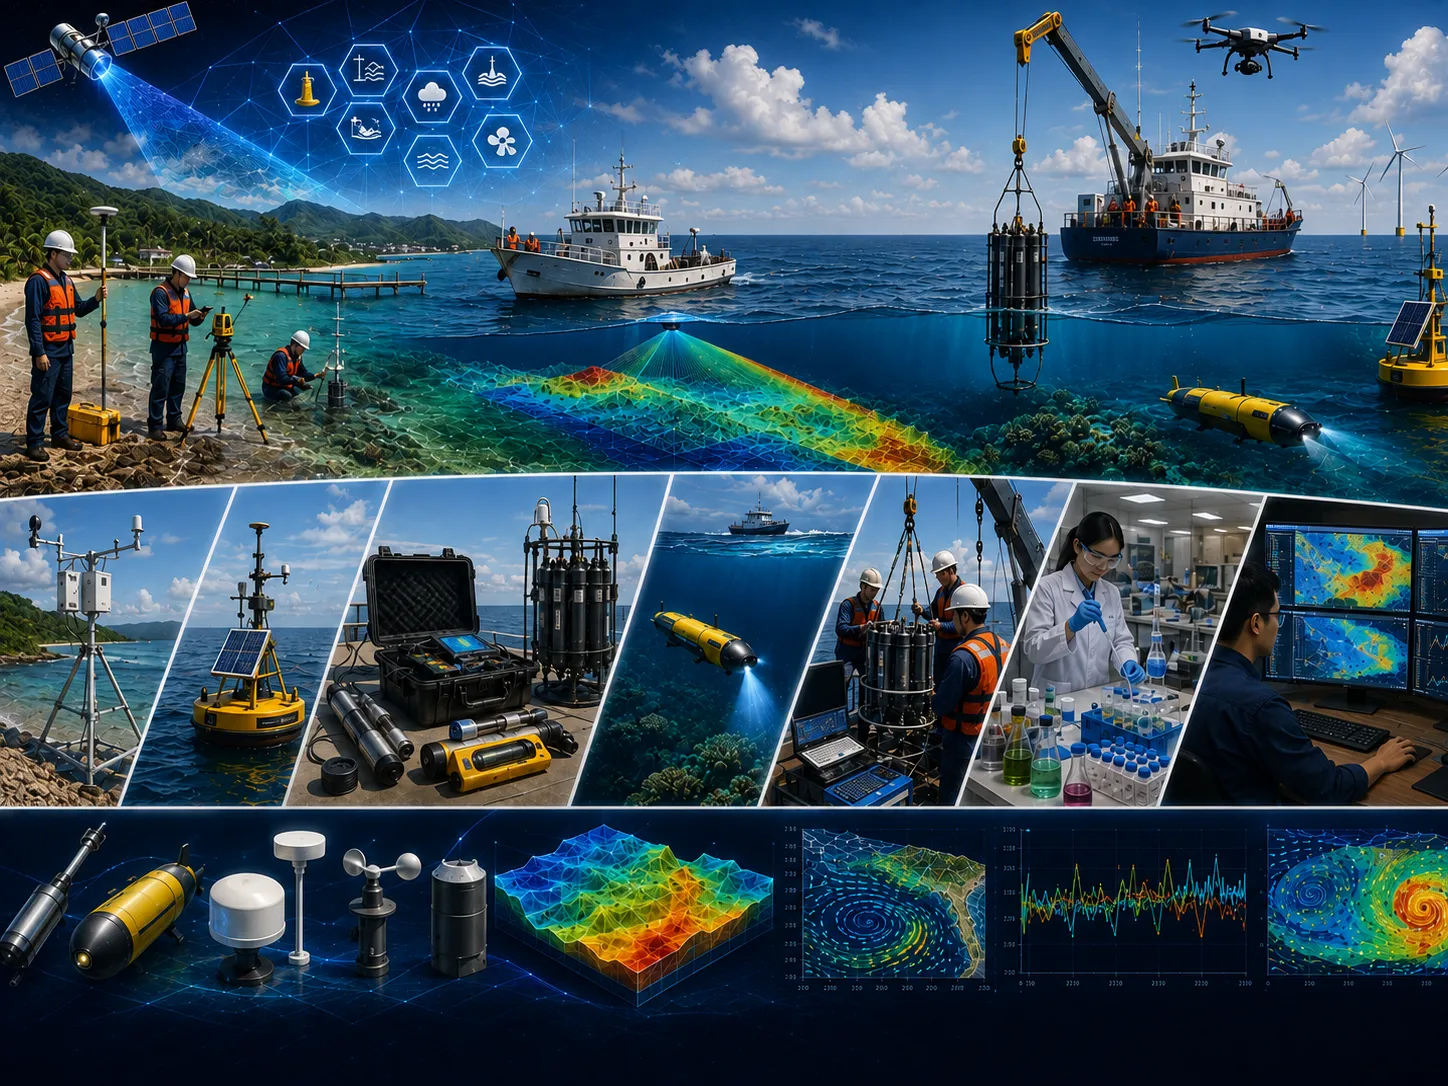
Methods, results, limitations, recommendations, action priorities, and stakeholder presentation materials.
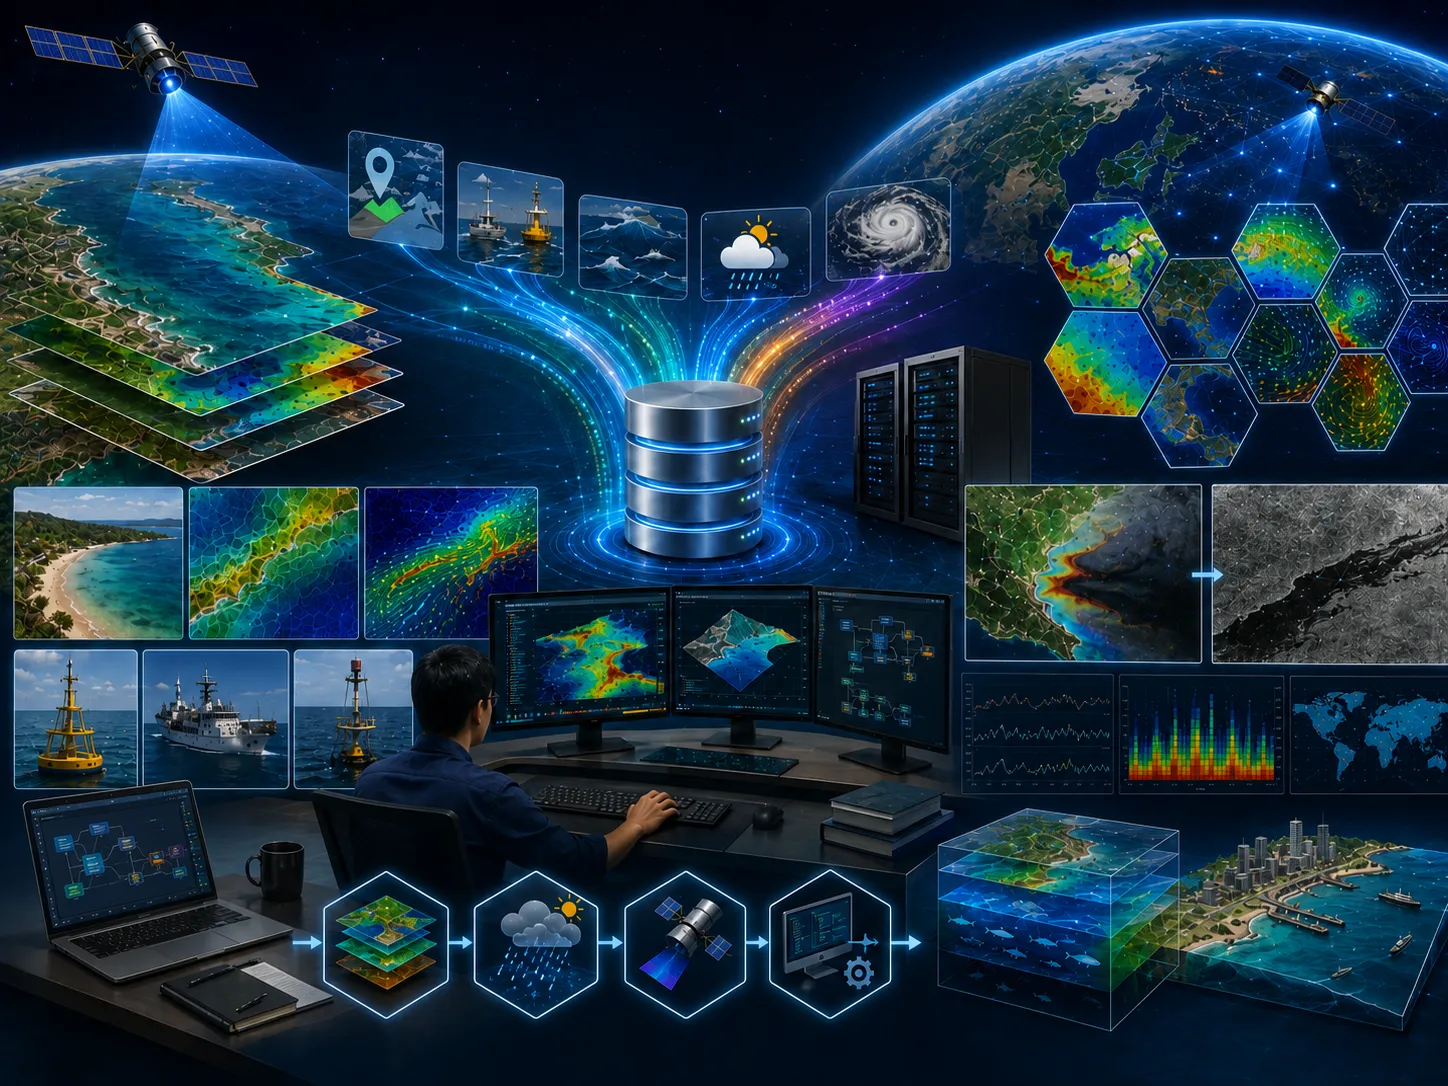
Assumptions, data, variability, and limitations are stated so decision risk is not hidden.
Alternative locations, designs, operations, or policies are assessed using consistent indicators.
Data needs and analysis depth are proportionate to risk so resources are used efficiently.
Findings and recommendations are transparent for technical, management, regulatory, and partner review.
Objectives, users, location, project phase, problems, constraints, and the decision to support.
Methods, data, surveys, models, schedule, team, deliverables, review gates, and resource estimate.
Collection, inspection, harmonization, documentation, and data-sufficiency assessment.
Processing, modeling, validation, option comparison, sensitivity, and risk evaluation.
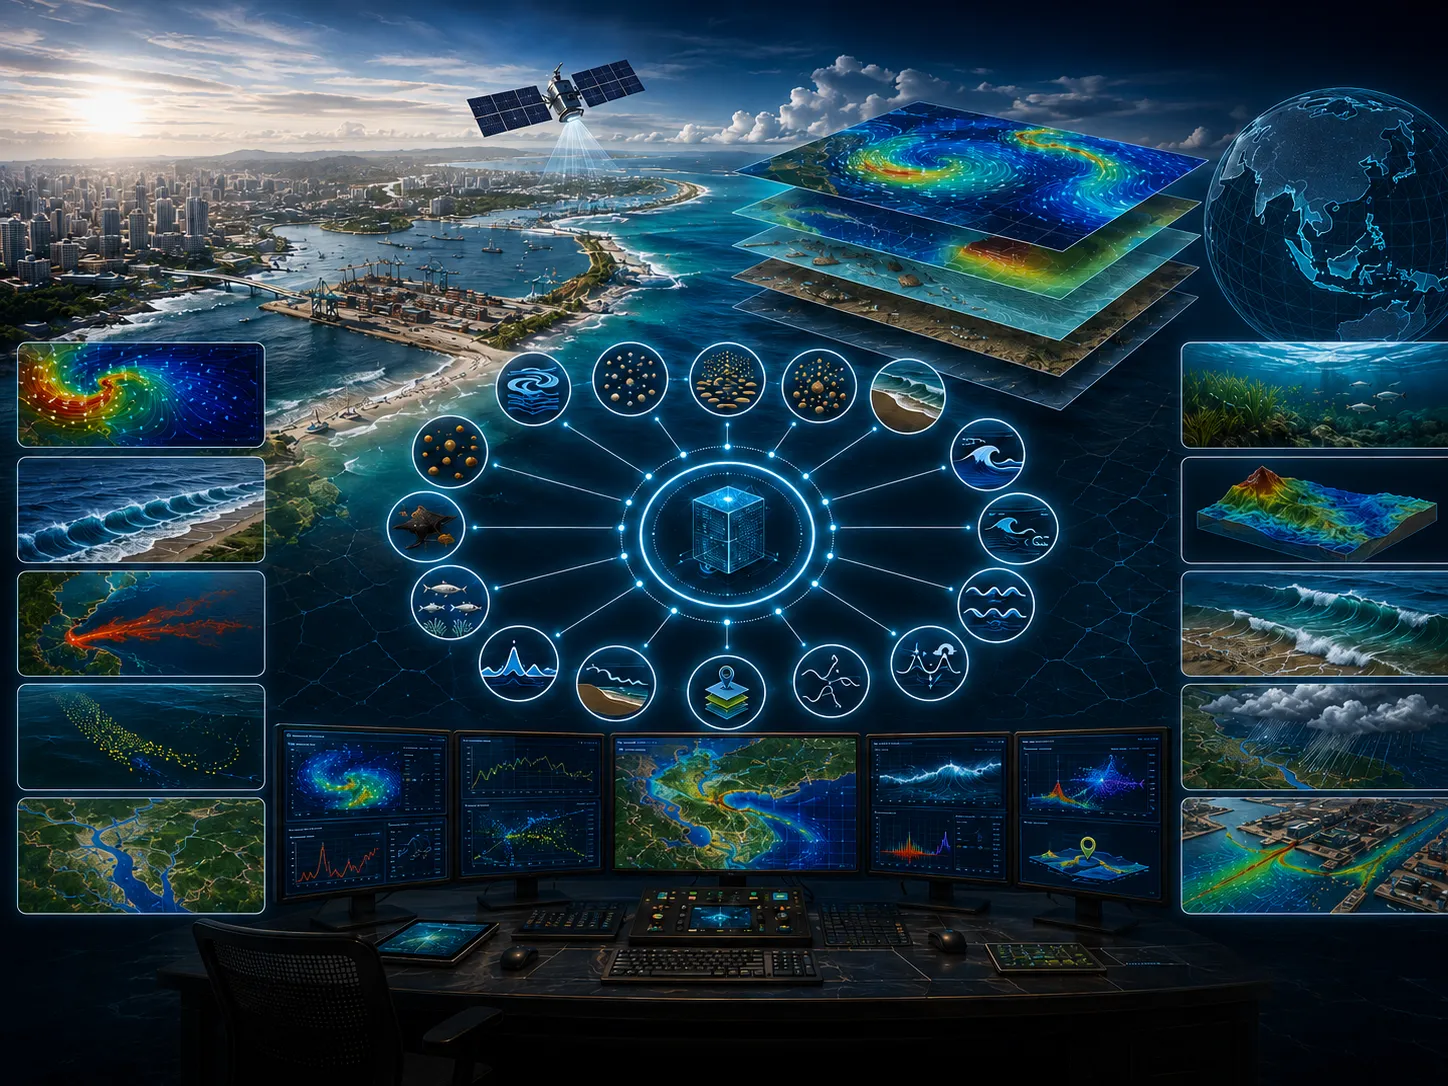
Maps, report, executive brief, presentation, supporting data, and follow-up plan.
Indonesia's marine aquaculture industry has experienced periods of remarkable growth as well as rapid decline. While market fluctuations, changing product prices, and marketing challenges contribute to business performance, the most significant cause of aquaculture failure is often the deterioration of environmental conditions within the farming area. A notable example occurred along the northern coast of Java, where shrimp farming once generated substantial economic returns. However, increasing environmental pressure from wastewater discharges led to recurring disease outbreaks, repeated crop failures, and ultimately the collapse of many aquaculture operations.
The primary challenges facing marine aquaculture include selecting unsuitable farming locations, inadequate environmental carrying capacity, poor selection of cultured species for local environmental conditions, and ineffective farm management strategies. These challenges can be significantly reduced when advanced numerical modeling is incorporated throughout the entire project lifecycle—from site selection and infrastructure planning to daily farm operation and long-term management. Modeling technologies enable decision-makers to simulate environmental conditions, evaluate alternative development scenarios, and optimize aquaculture performance before costly investments are made.
Advanced numerical modeling provides a scientific foundation for sustainable marine aquaculture by supporting informed decision-making throughout planning, development, and operational phases. Through comprehensive simulations of the physical, chemical, and biological characteristics of coastal waters, modeling identifies suitable farming locations, evaluates environmental carrying capacity, determines the most appropriate species for cultivation, and develops optimal operational strategies. This integrated approach reduces environmental risks, improves production efficiency, minimizes economic losses, and promotes the long-term sustainability of aquaculture enterprises.
This integrated modeling framework enables decision-makers to select the most suitable aquaculture sites, optimize environmental carrying capacity, match cultured species with local ocean conditions, improve operational efficiency, reduce production risks, enhance profitability, and ensure the sustainable development of marine aquaculture through science-based decision-making.
Coastal flooding has become an increasingly significant challenge as rising sea levels associated with global climate change continue to affect coastal regions worldwide.
Learn more →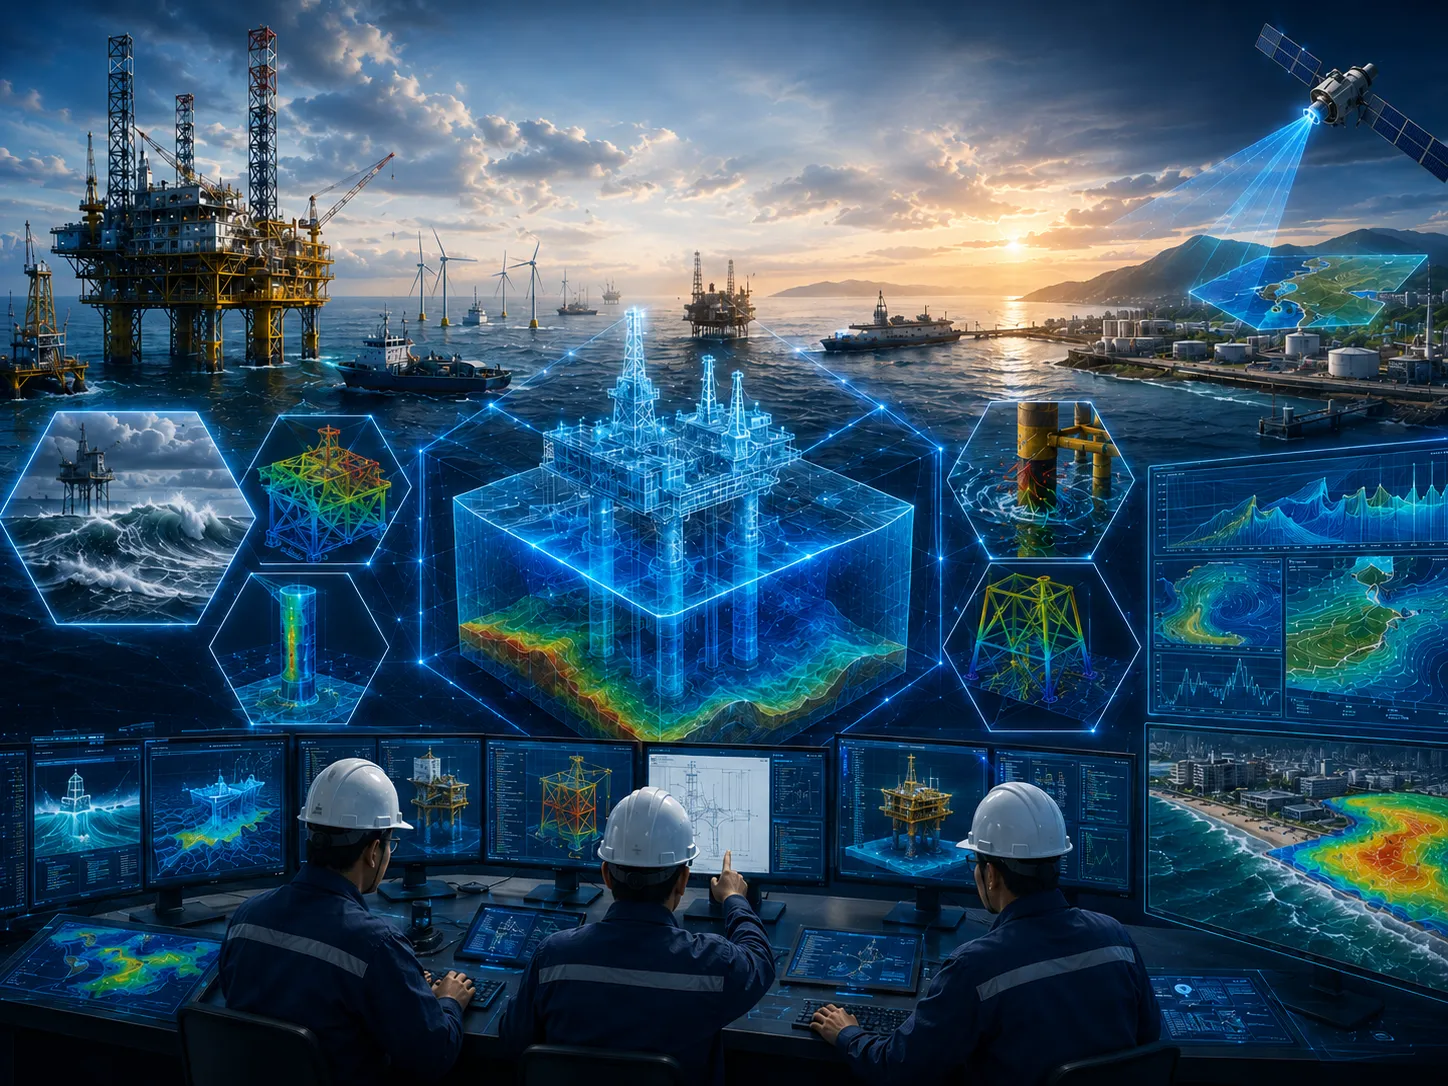
The coastal and offshore industry is experiencing rapid growth and is expected to continue expanding as advances in marine technology enable more effective utilization of ocean resources.
Learn more →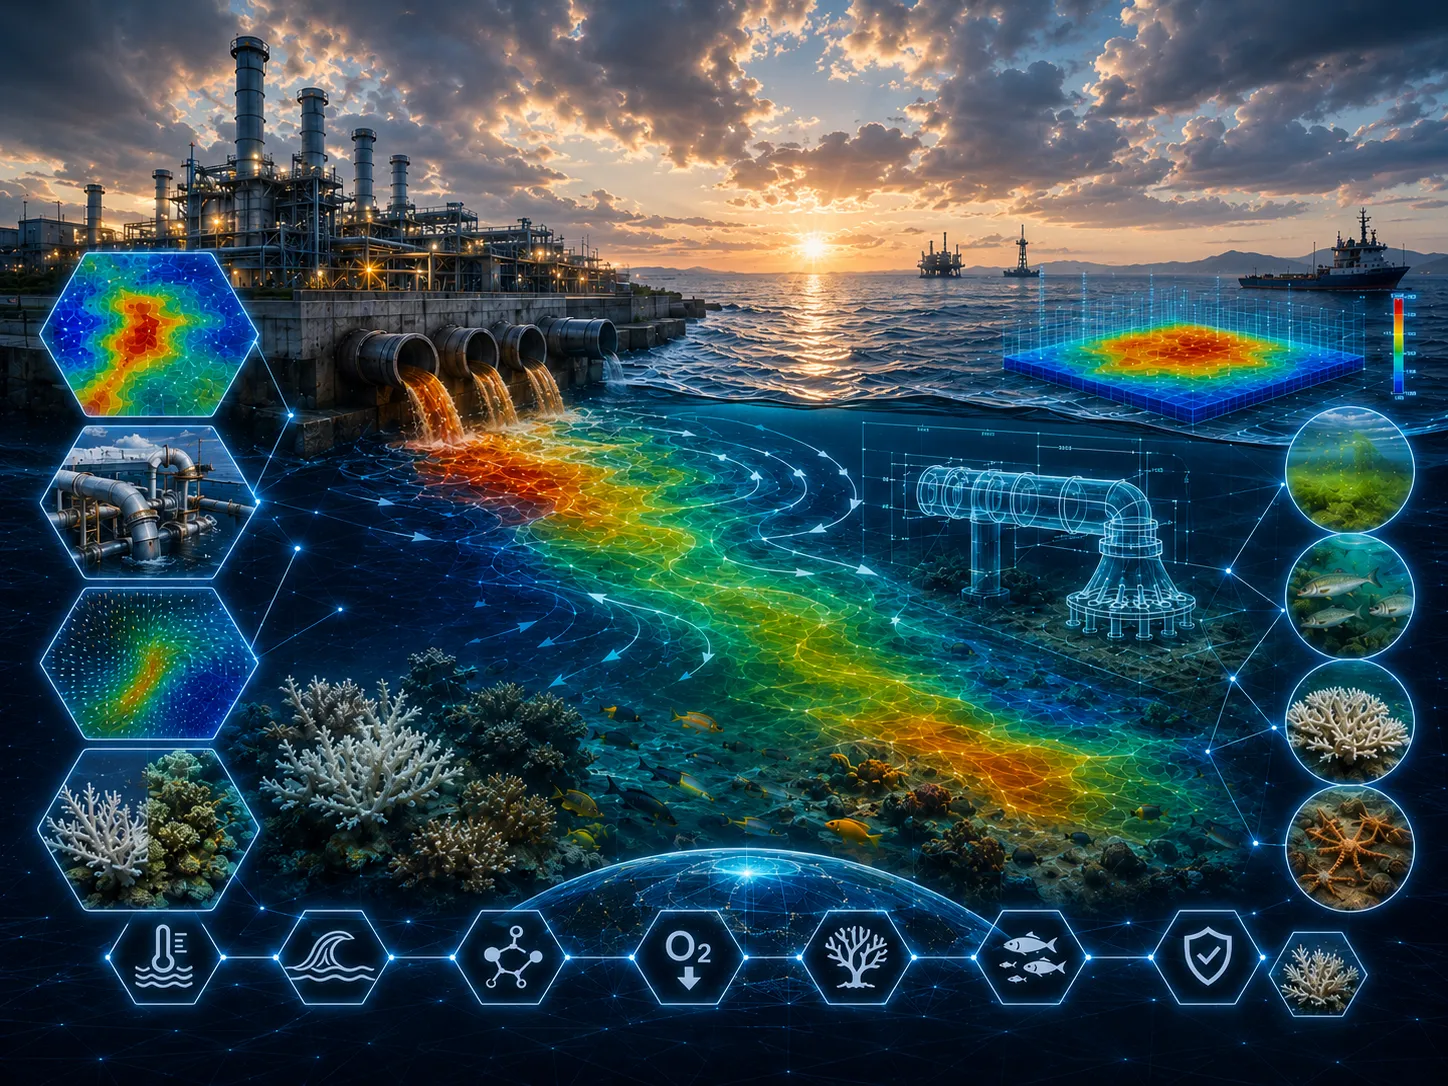
Changes in seawater temperature can significantly affect photosynthesis, aerobic respiration, growth, reproduction, metabolism, and survival of marine organisms.
Learn more →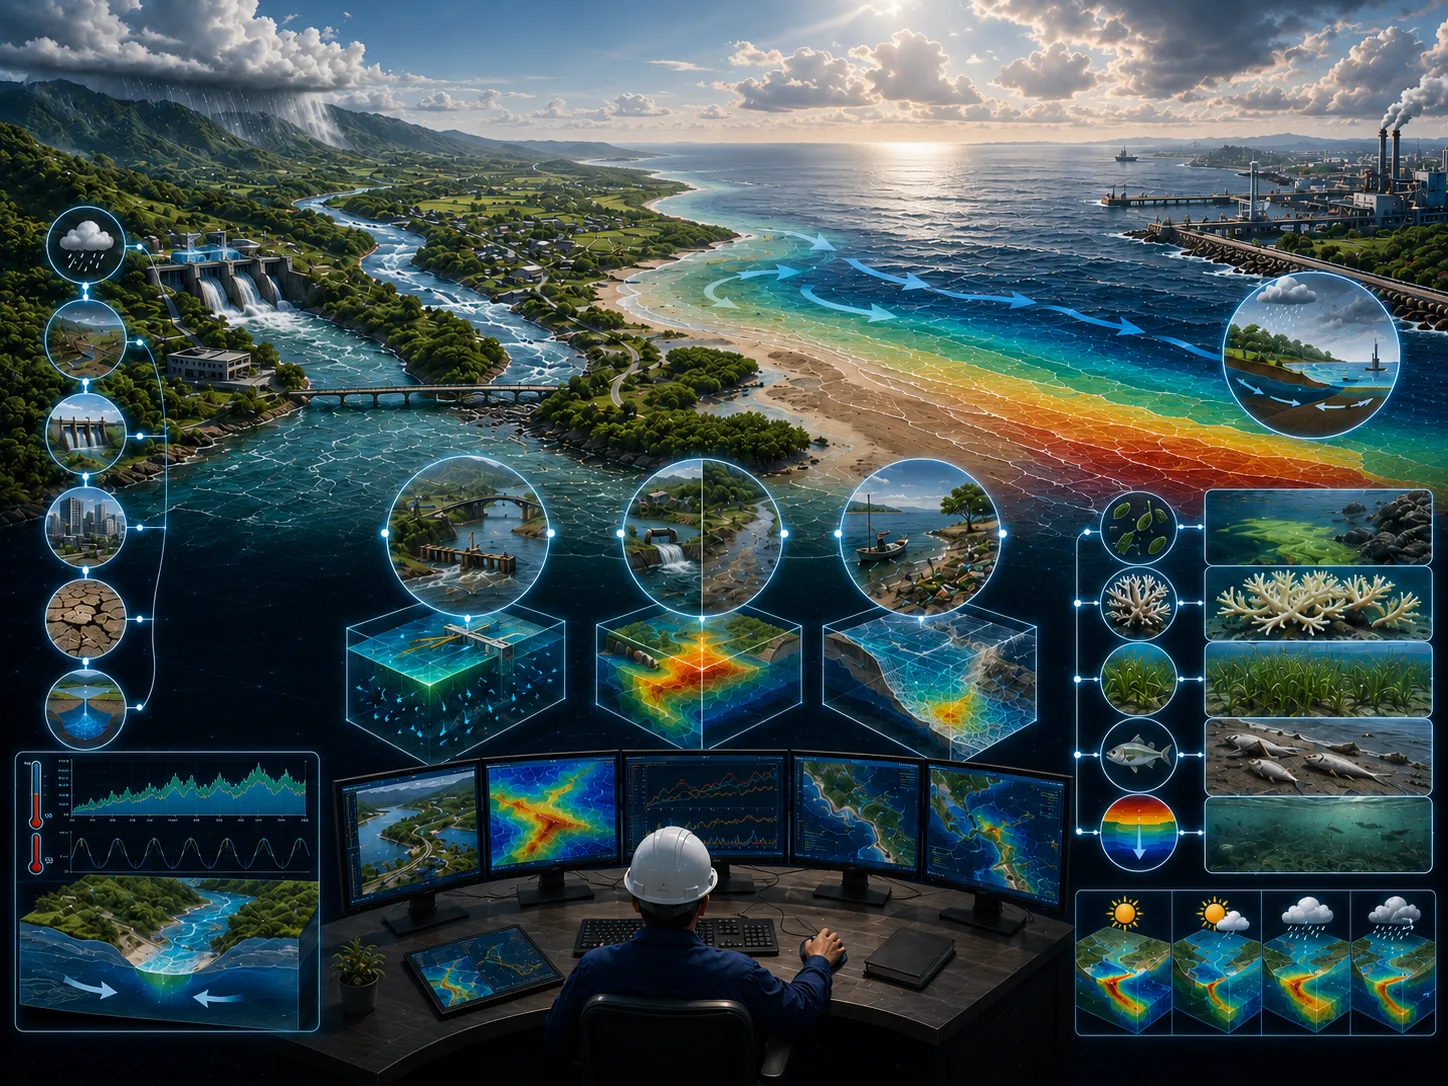
Changes in freshwater inflow from rivers and surface runoff play a critical role in controlling environmental conditions within estuaries and adjacent coastal waters.
Learn more →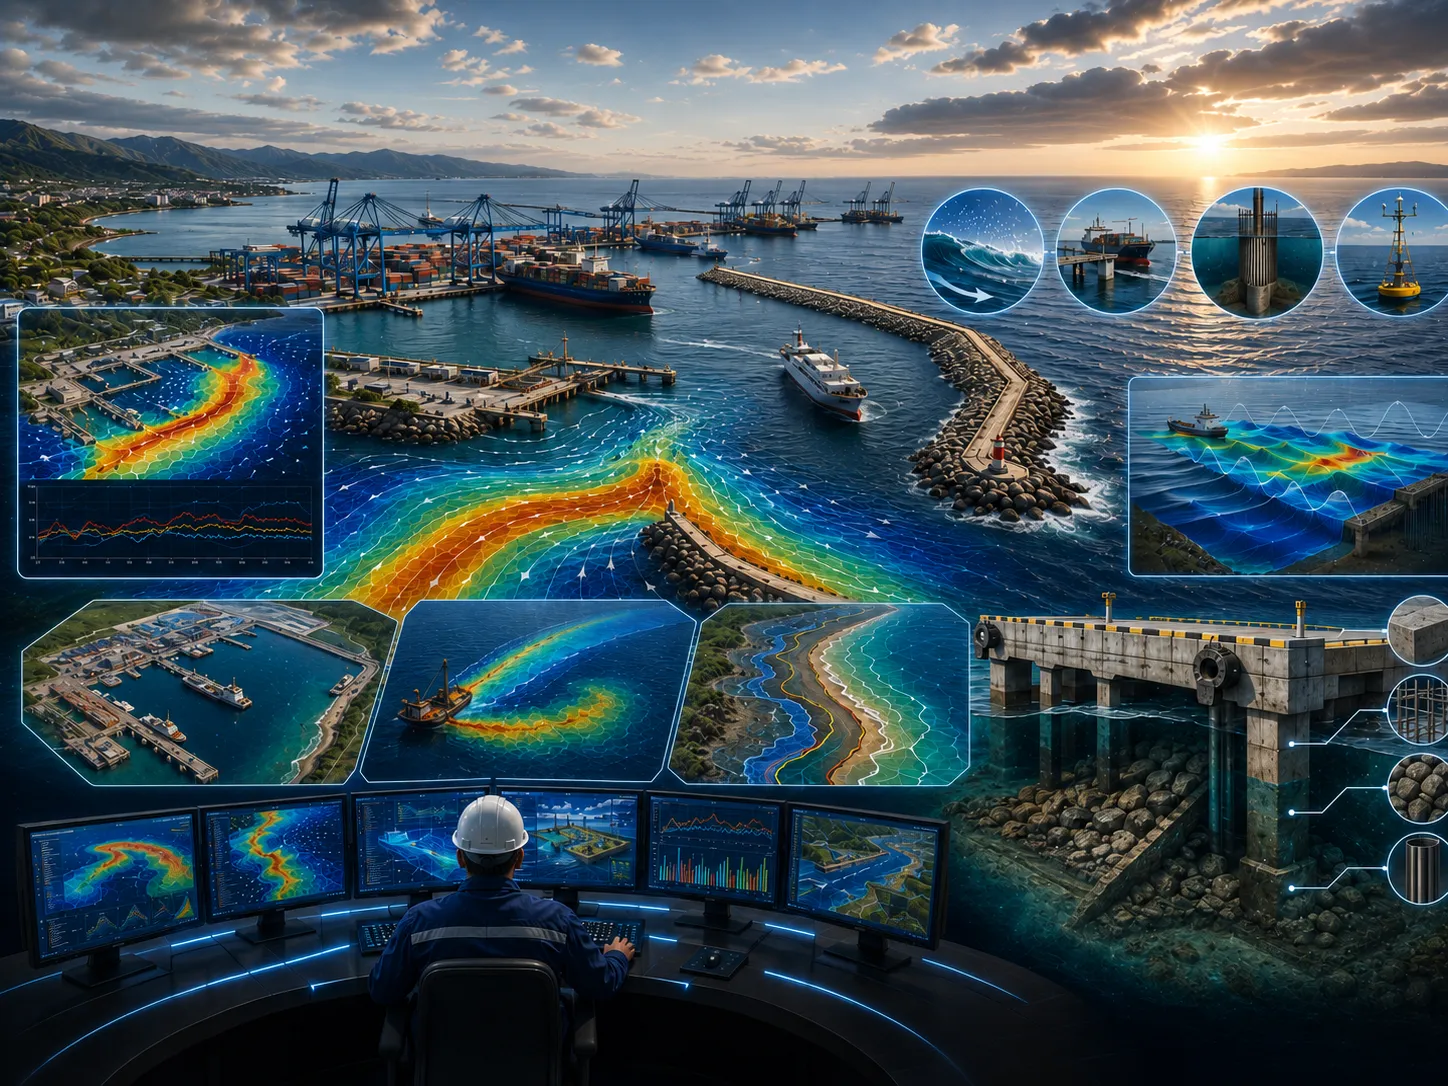
Planning and designing modern port infrastructure is a highly complex engineering process.
Learn more →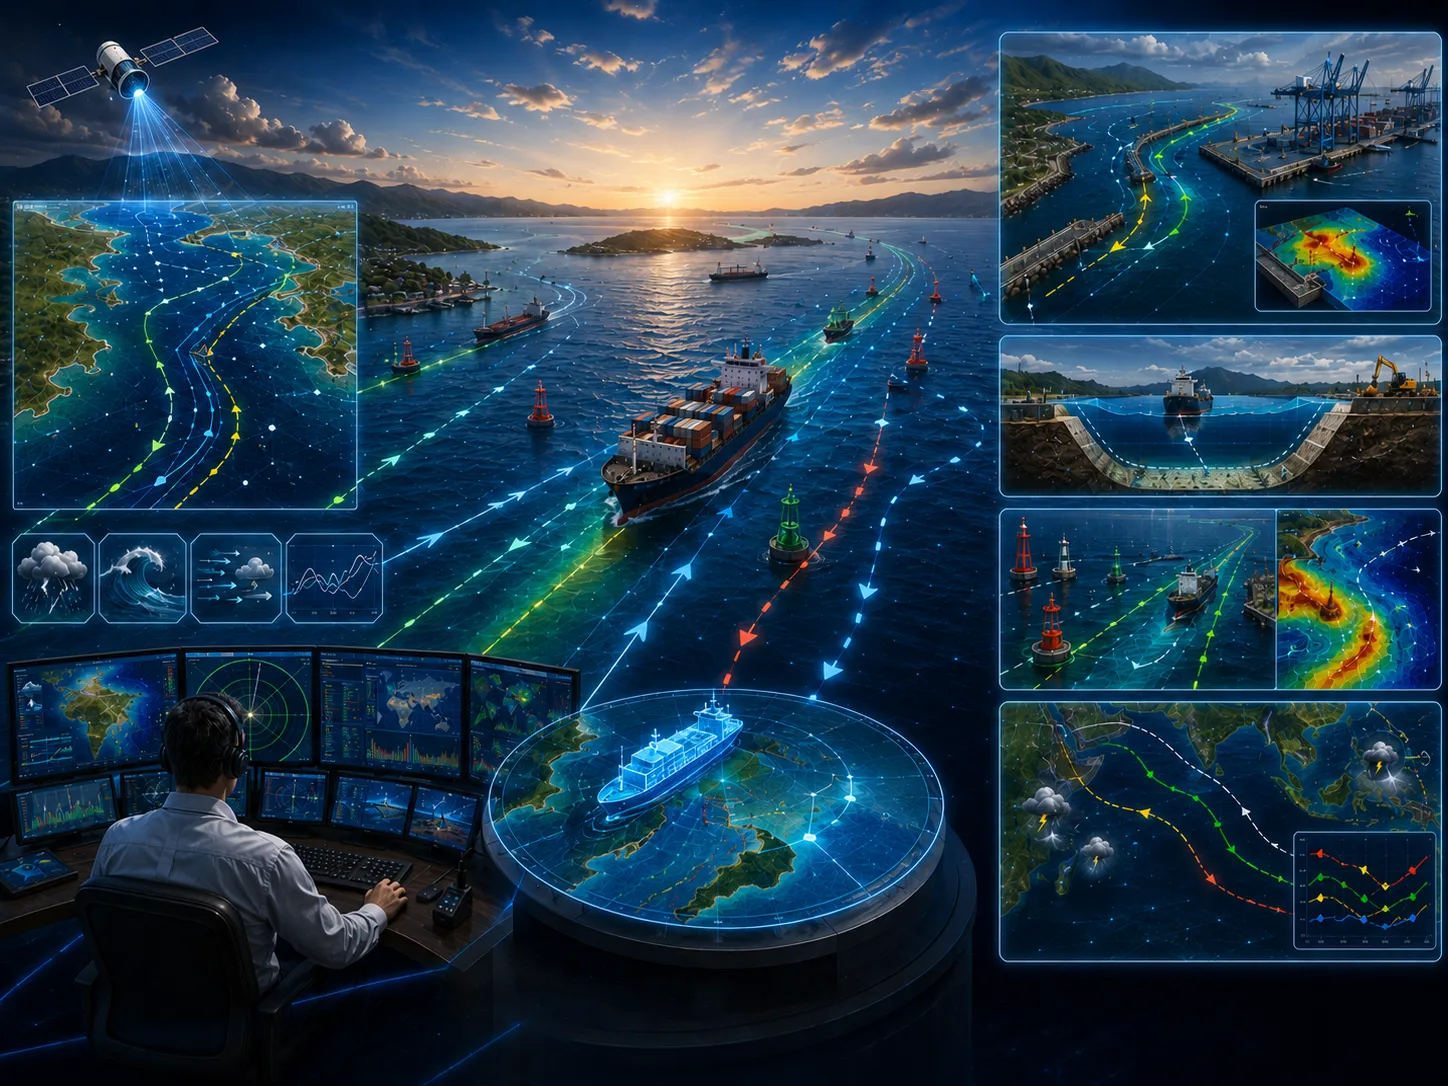
Planning shipping routes for vessels traveling between ports and across different marine regions is a critical process that requires careful evaluation.
Learn more →The CORZ team will review the objective, scope, data availability, risk level, schedule, and required outputs to prepare a proportionate approach.
Share the location, objectives, key challenges, available data, and expected outputs. The CORZ team will help define a proportionate technical approach.