
CONTEXTField conditions and systems being assessed
Enter at least two characters.
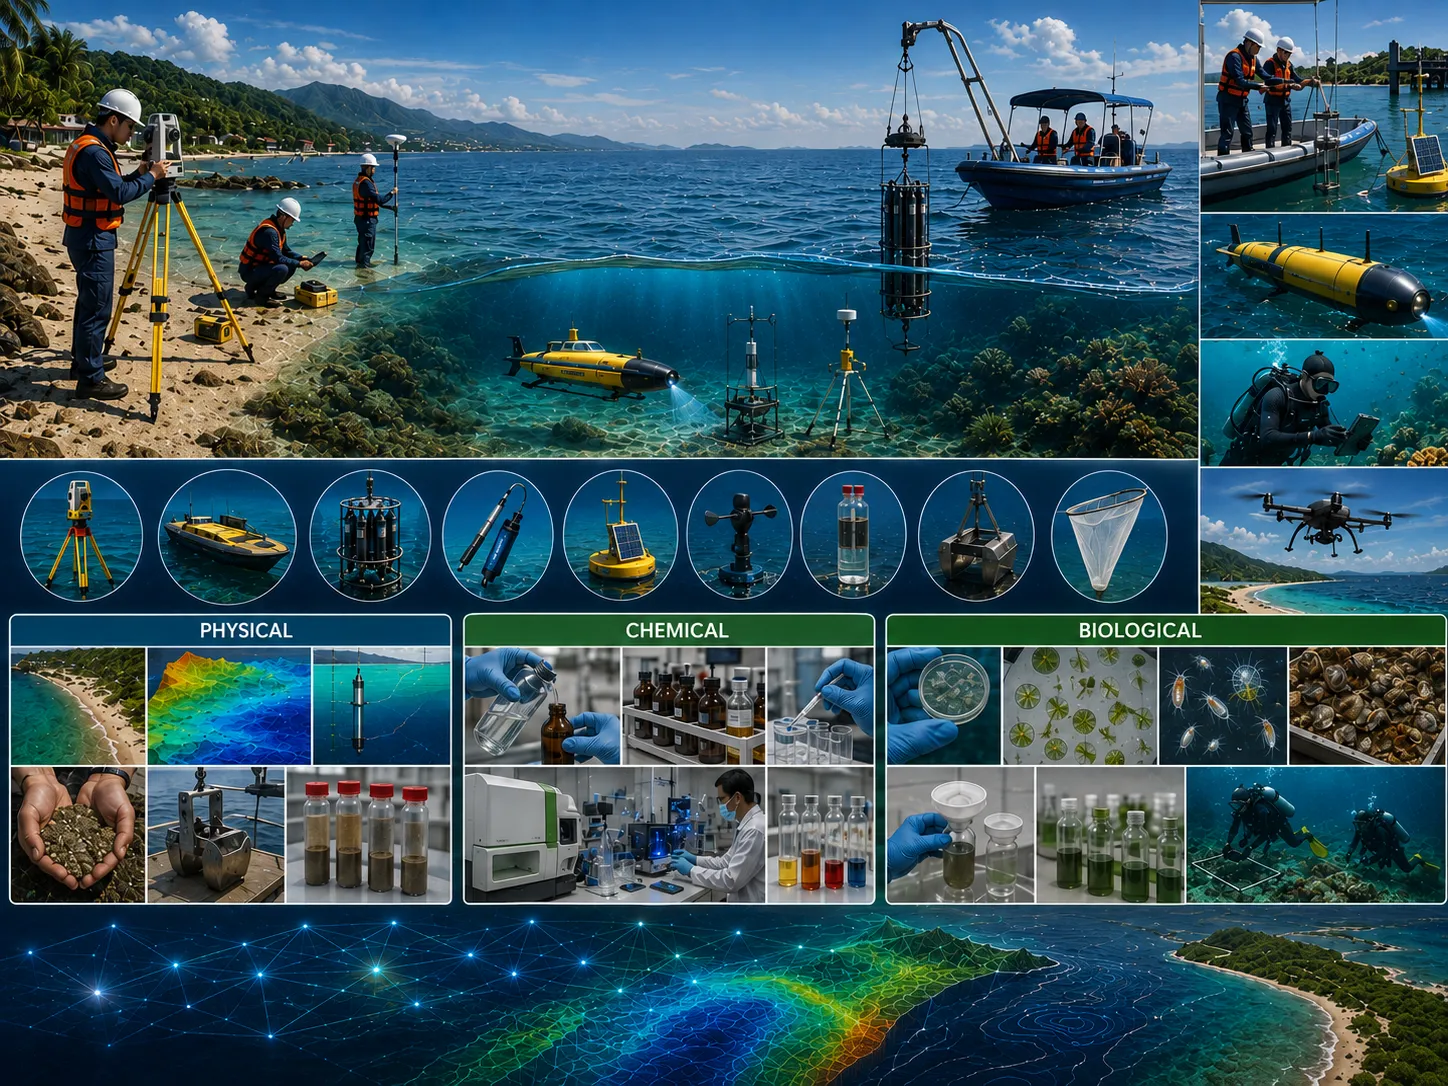
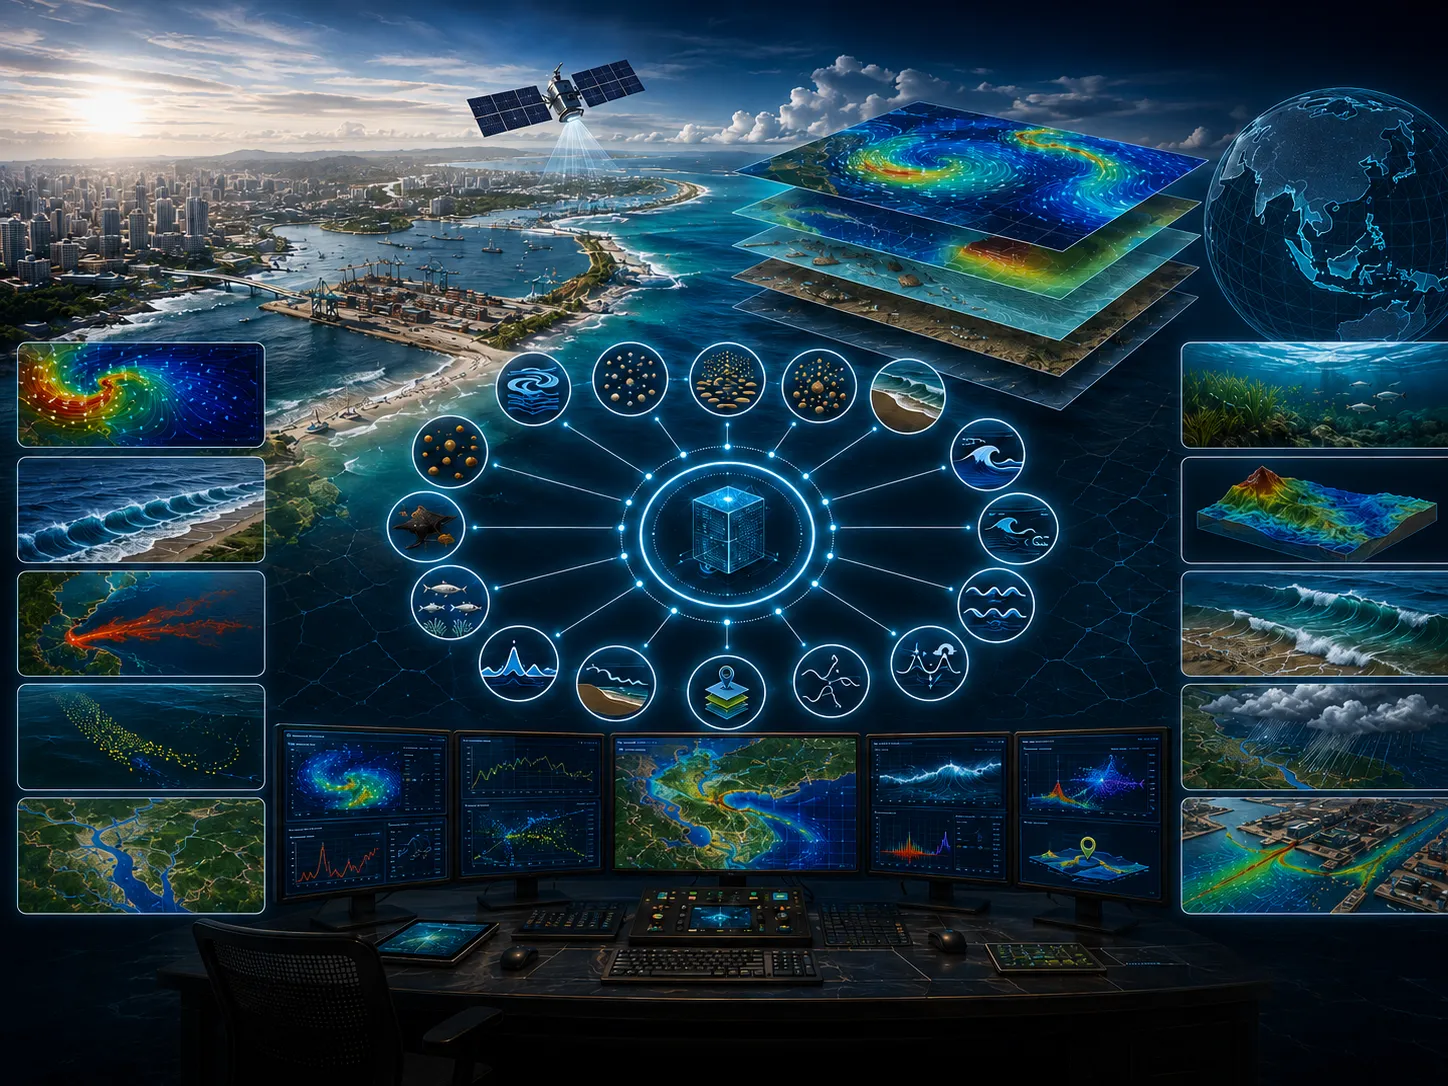
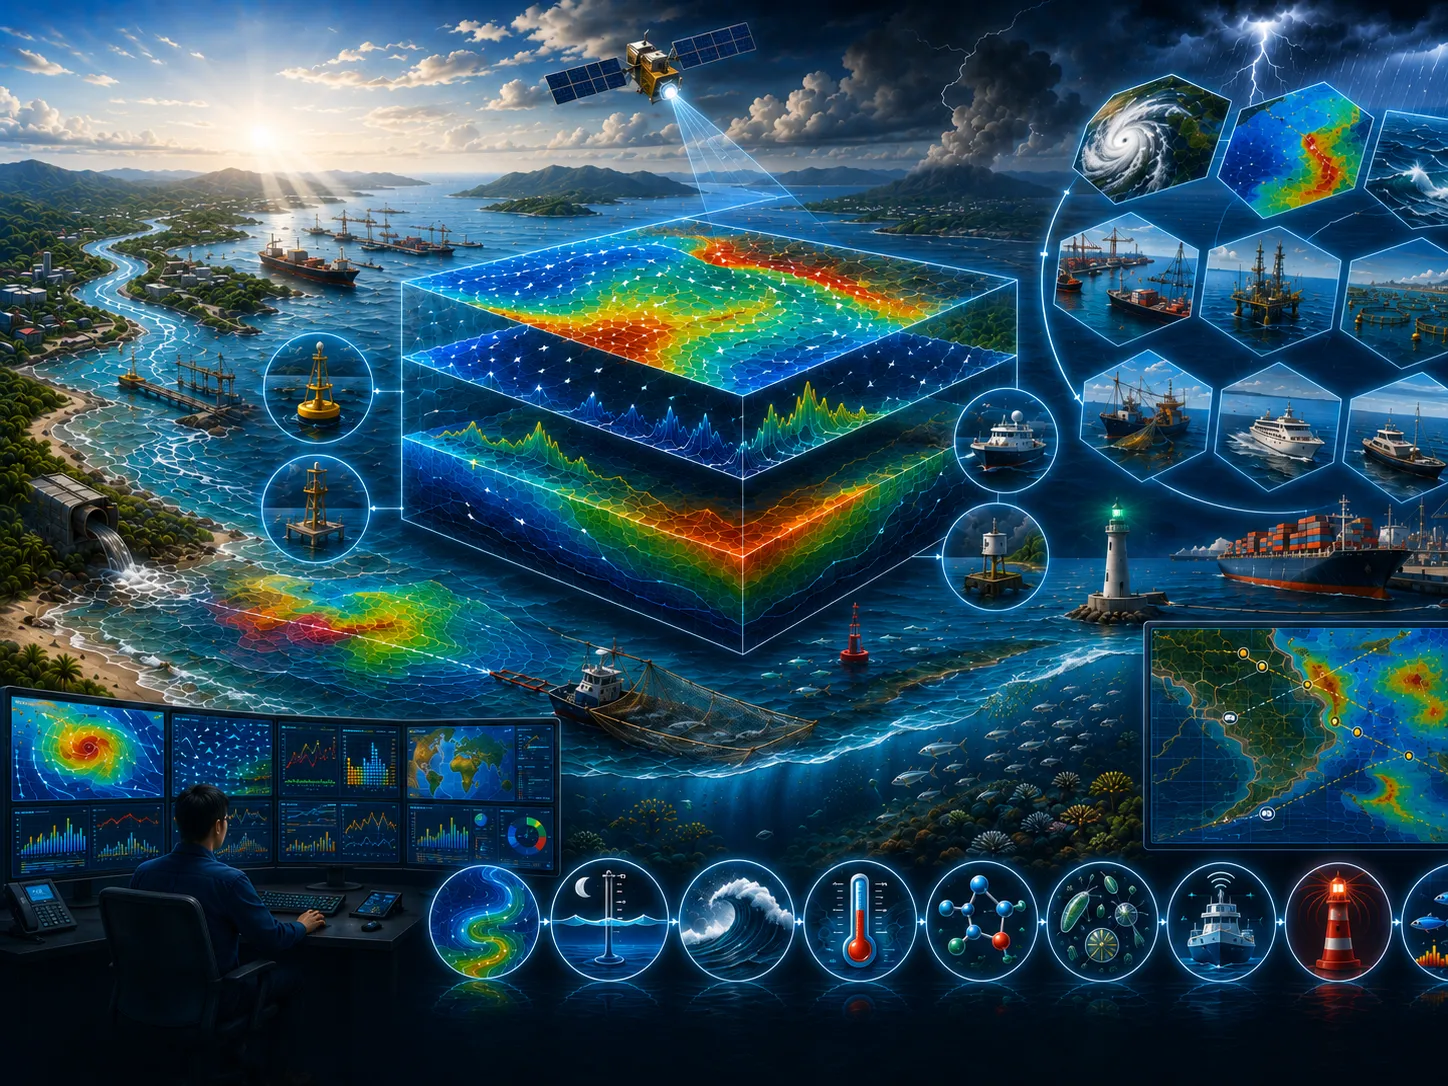
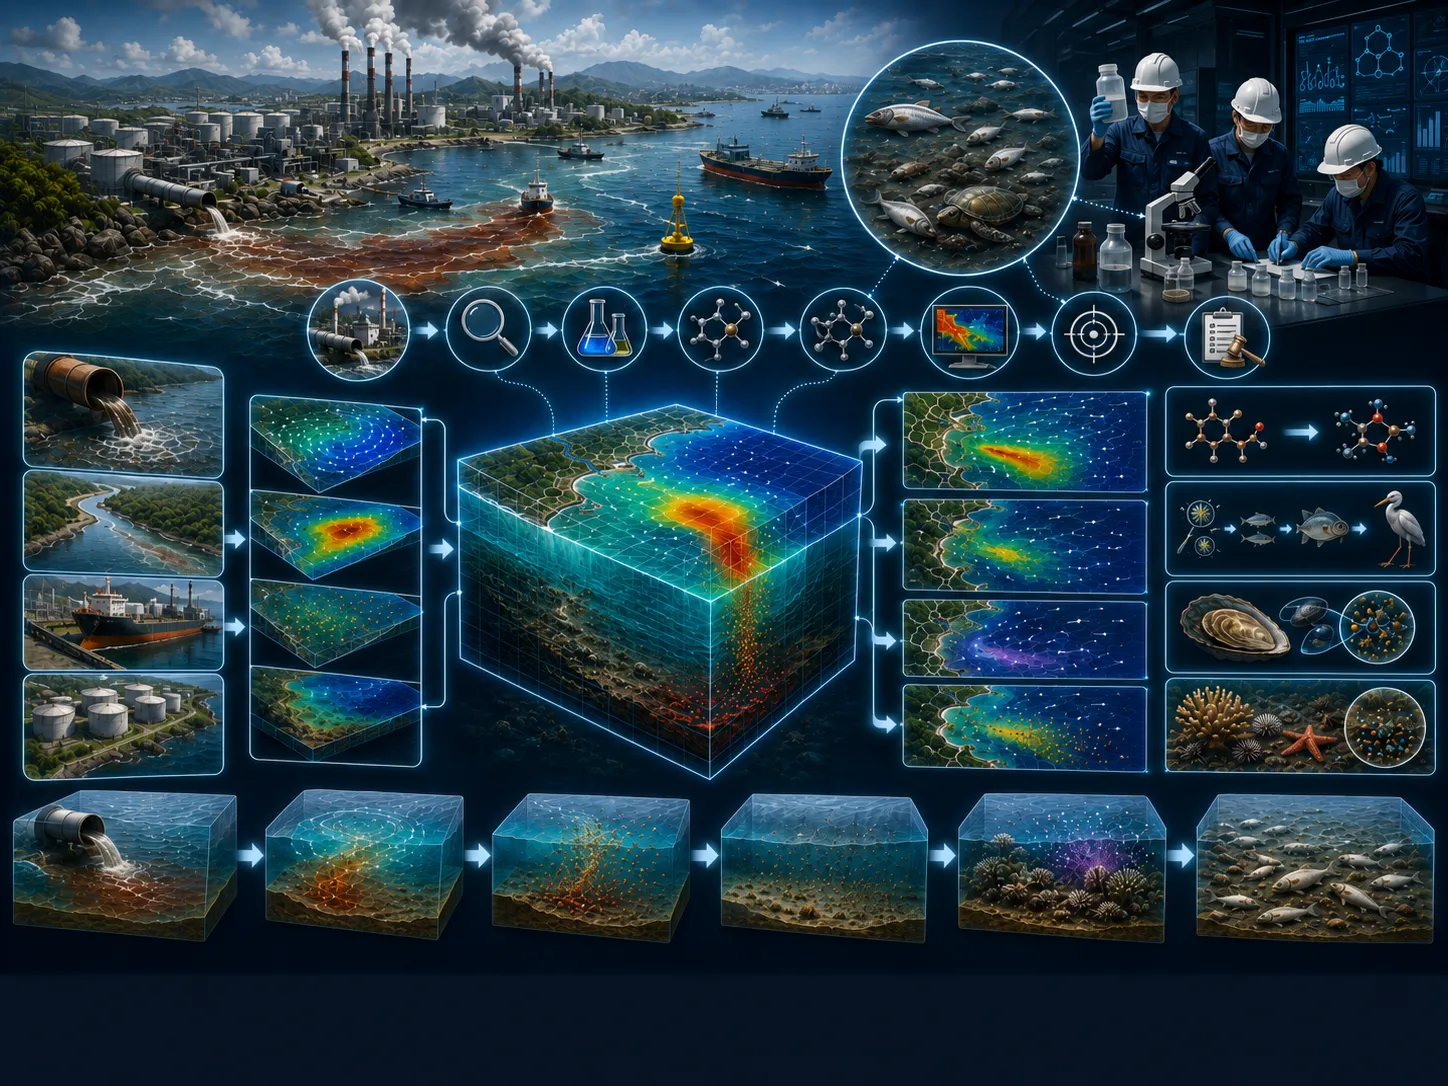
Modeling developed for coastal waters requires careful preparation of modeling scenarios, as well as the data and parameters needed as model inputs.
This page includes a one-page leaflet that can be opened in a full-image popup. It helps present the core CORZ service clearly and convincingly during project discussions, executive briefings, and decision-support meetings.
With a more proportional balance between visuals and text, the page feels brighter and more energetic while still keeping the important technical context visible and easy to understand.
Use this leaflet as a concise visual entry point before moving into the more detailed technical explanation.
Clarity before a decision is made
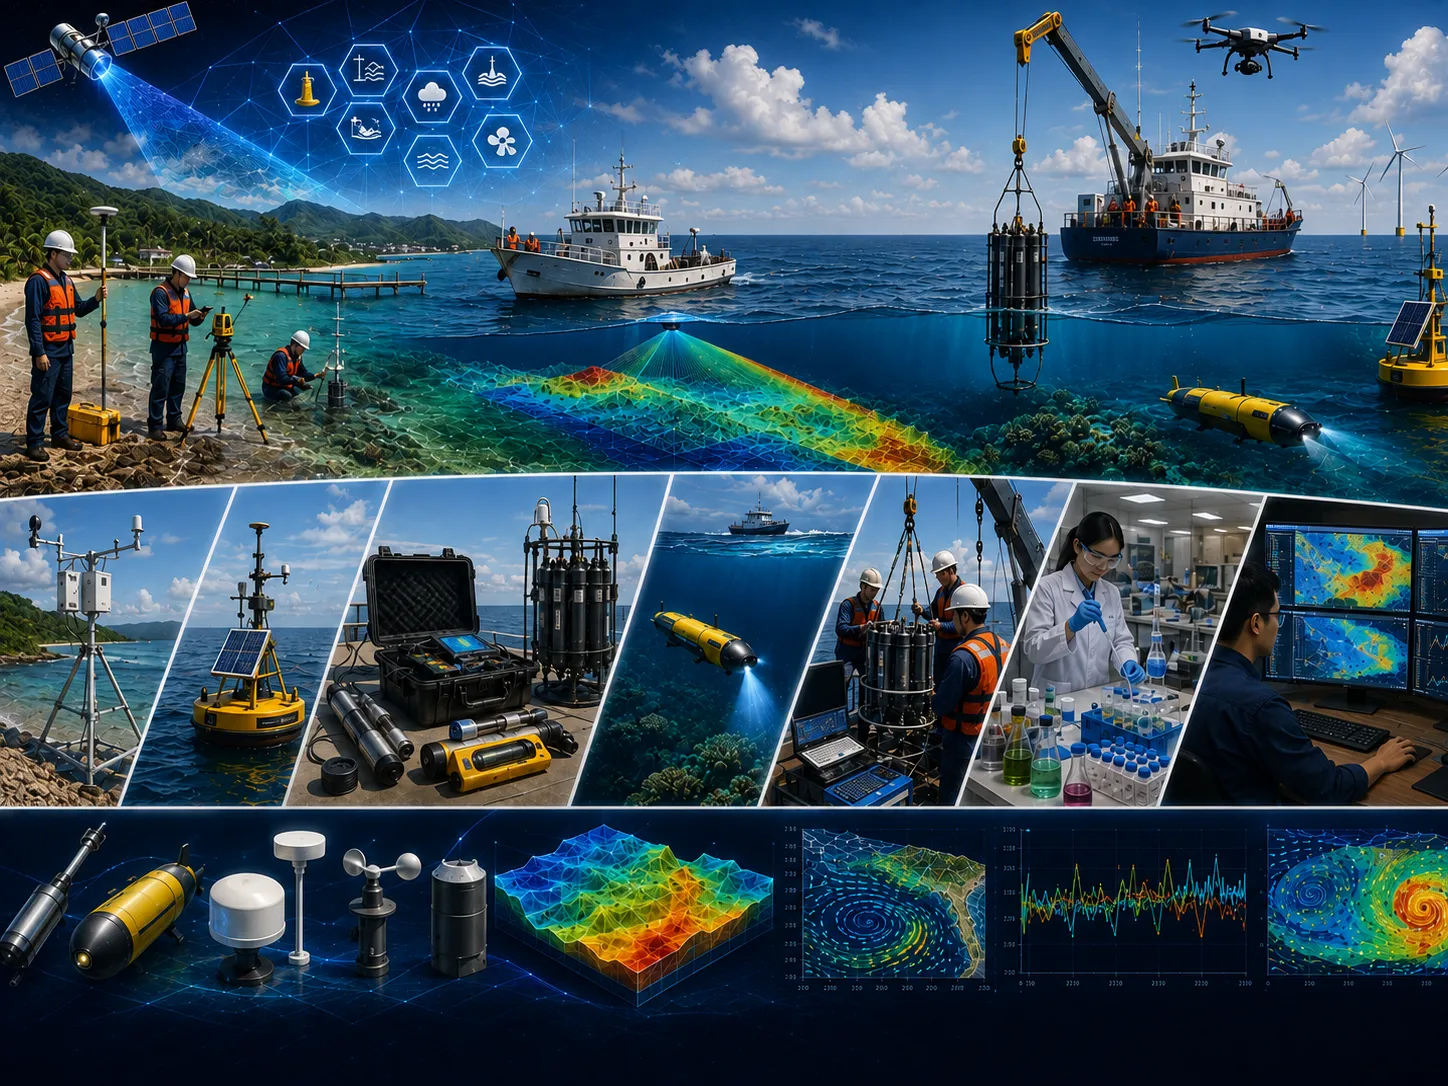
Modeling developed for coastal waters requires careful preparation of modeling scenarios, as well as the data and parameters needed as model inputs.
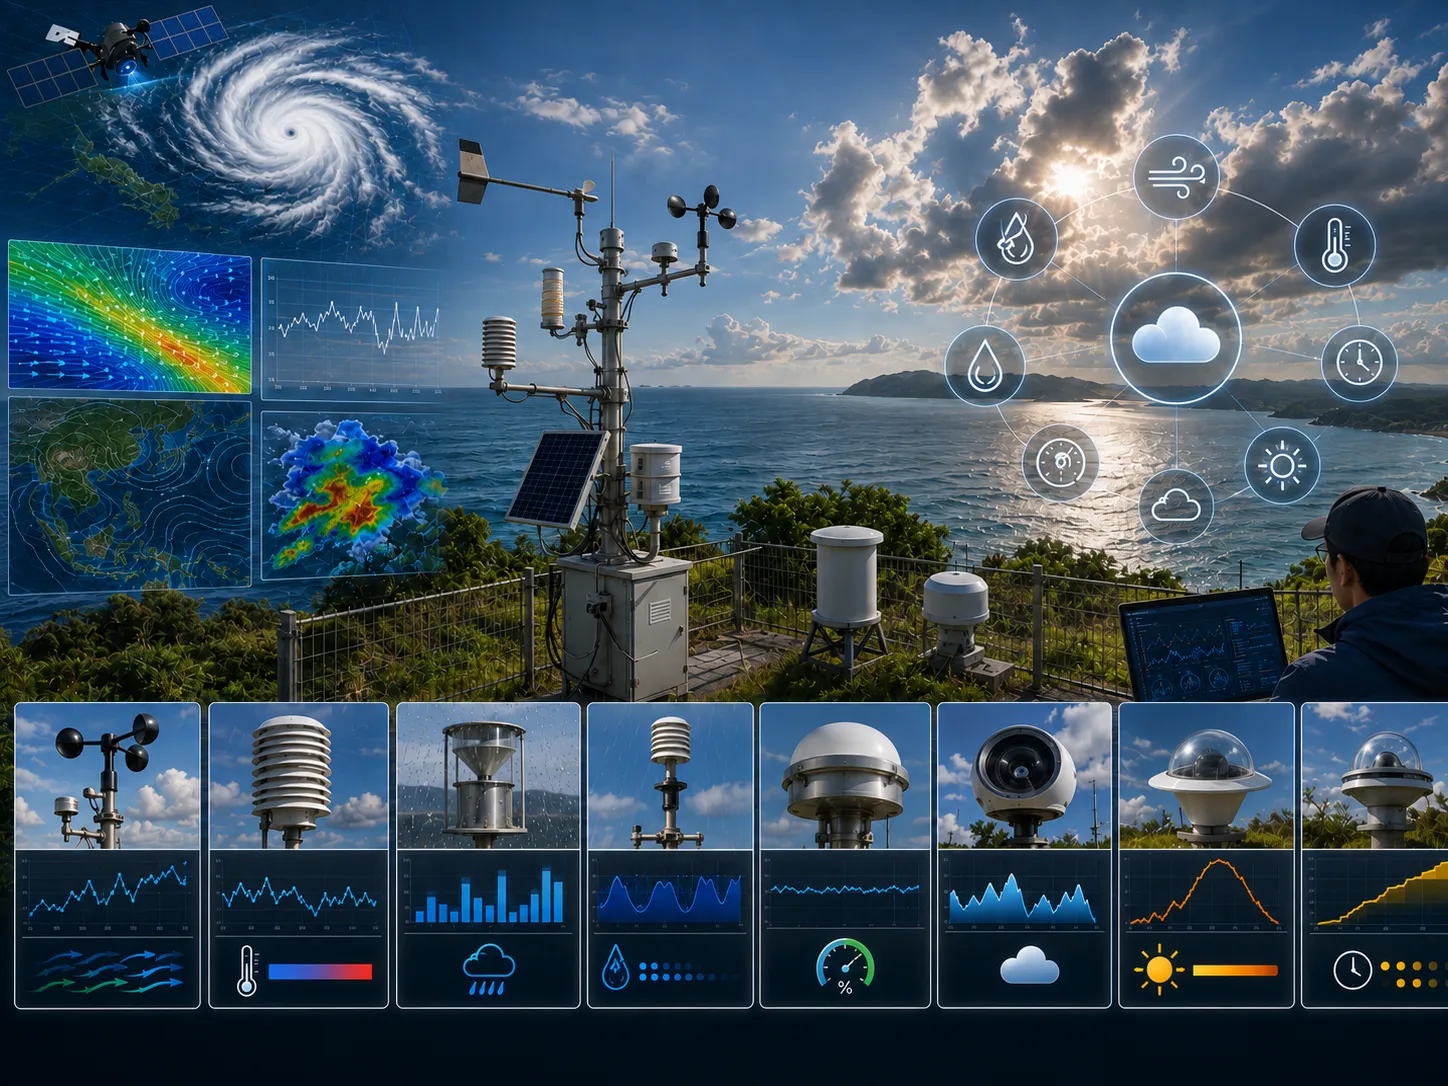
Various tools and instruments are provided with specific types and specifications suitable for coastal waters. These tools and instruments are grouped based on the parameters to be measured, as follows:
Define the approach, priorities, and actions for coastal using traceable evidence.
Non-representative data, missed critical periods, and inefficient field cost.
Quality-controlled data that meet the assessment objective and are analysis-ready.
This aspect is assessed to clarify its implications for coastal.

This aspect is assessed to clarify its implications for coastal.

This aspect is assessed to clarify its implications for coastal.
This aspect is assessed to clarify its implications for coastal.

This aspect is assessed to clarify its implications for coastal.
This aspect is assessed to clarify its implications for coastal.
Field surveys, in-situ measurements, laboratory results, historical records, and operating information as required.
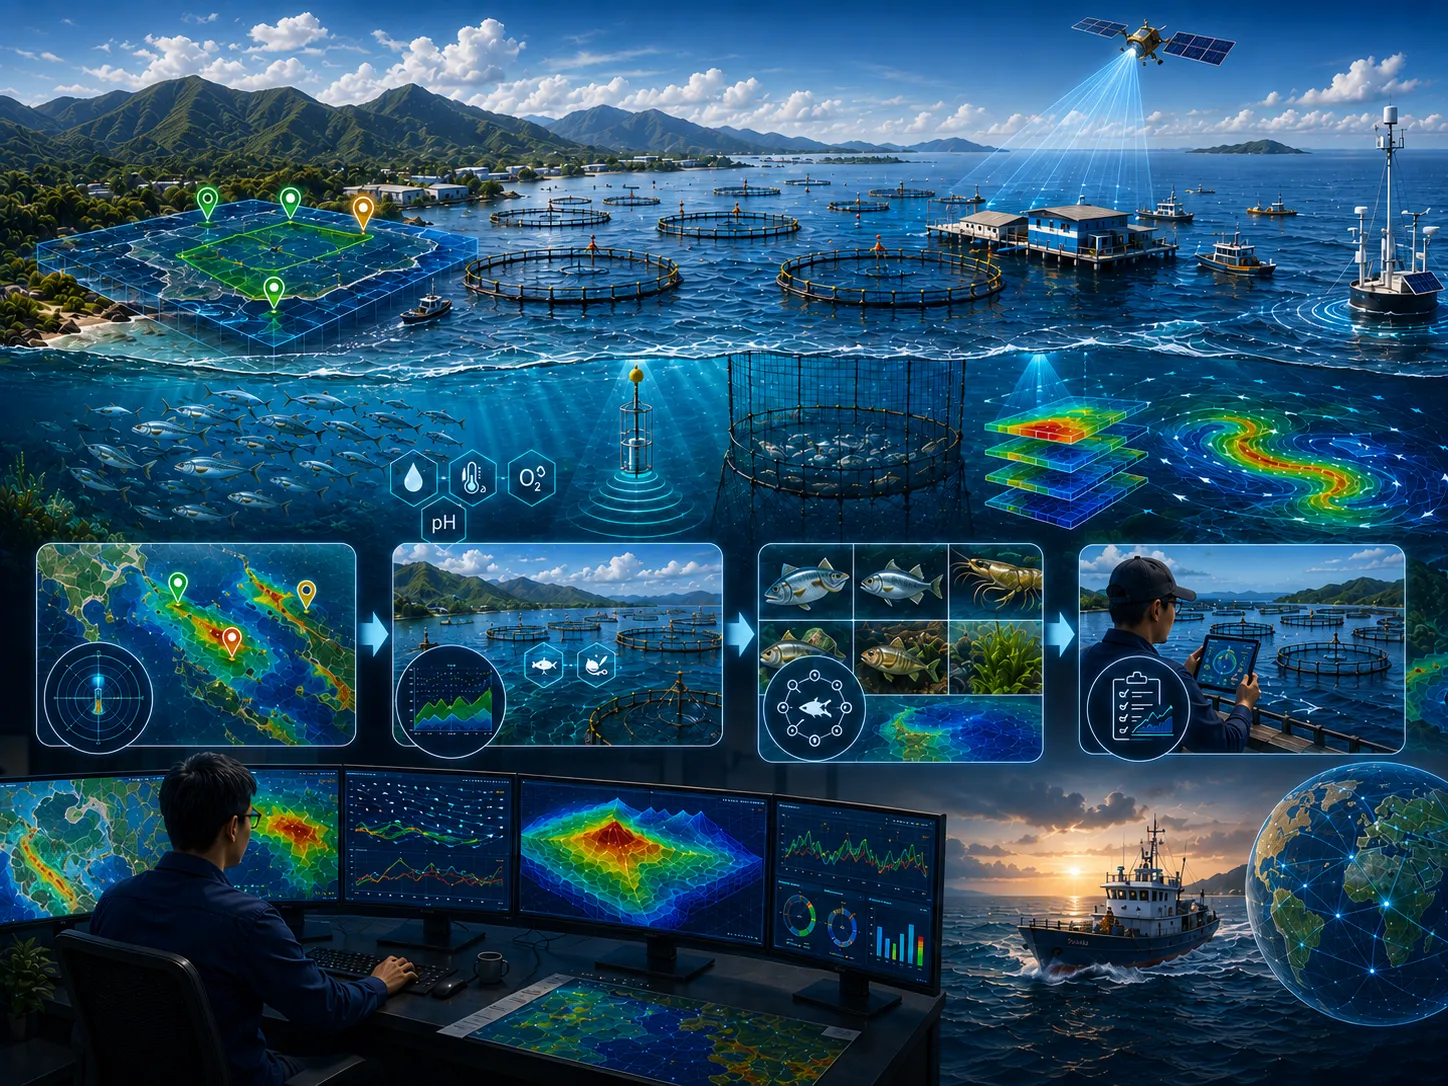
Satellite imagery, mapping, spatial analysis, temporal change, and integration of multiple data sources.

Model setup, calibration, validation, existing–planned–extreme scenarios, and sensitivity analysis.
Metadata, quality controls, assumptions, limitations, data versions, and processing lineage are documented.
Objectives, study area, available data, additional needs, initial risks, and recommended level of detail.
Quality-controlled data, thematic maps, time series, indicators, and comparable visualizations.
Comparison of existing conditions, alternatives, extremes, sensitivities, consequences, and mitigation options.
Methods, results, limitations, recommendations, action priorities, and stakeholder presentation materials.
Assumptions, data, variability, and limitations are stated so decision risk is not hidden.
Alternative locations, designs, operations, or policies are assessed using consistent indicators.
Data needs and analysis depth are proportionate to risk so resources are used efficiently.
Findings and recommendations are transparent for technical, management, regulatory, and partner review.
Objectives, users, location, project phase, problems, constraints, and the decision to support.
Methods, data, surveys, models, schedule, team, deliverables, review gates, and resource estimate.
Collection, inspection, harmonization, documentation, and data-sufficiency assessment.
Processing, modeling, validation, option comparison, sensitivity, and risk evaluation.
Maps, report, executive brief, presentation, supporting data, and follow-up plan.
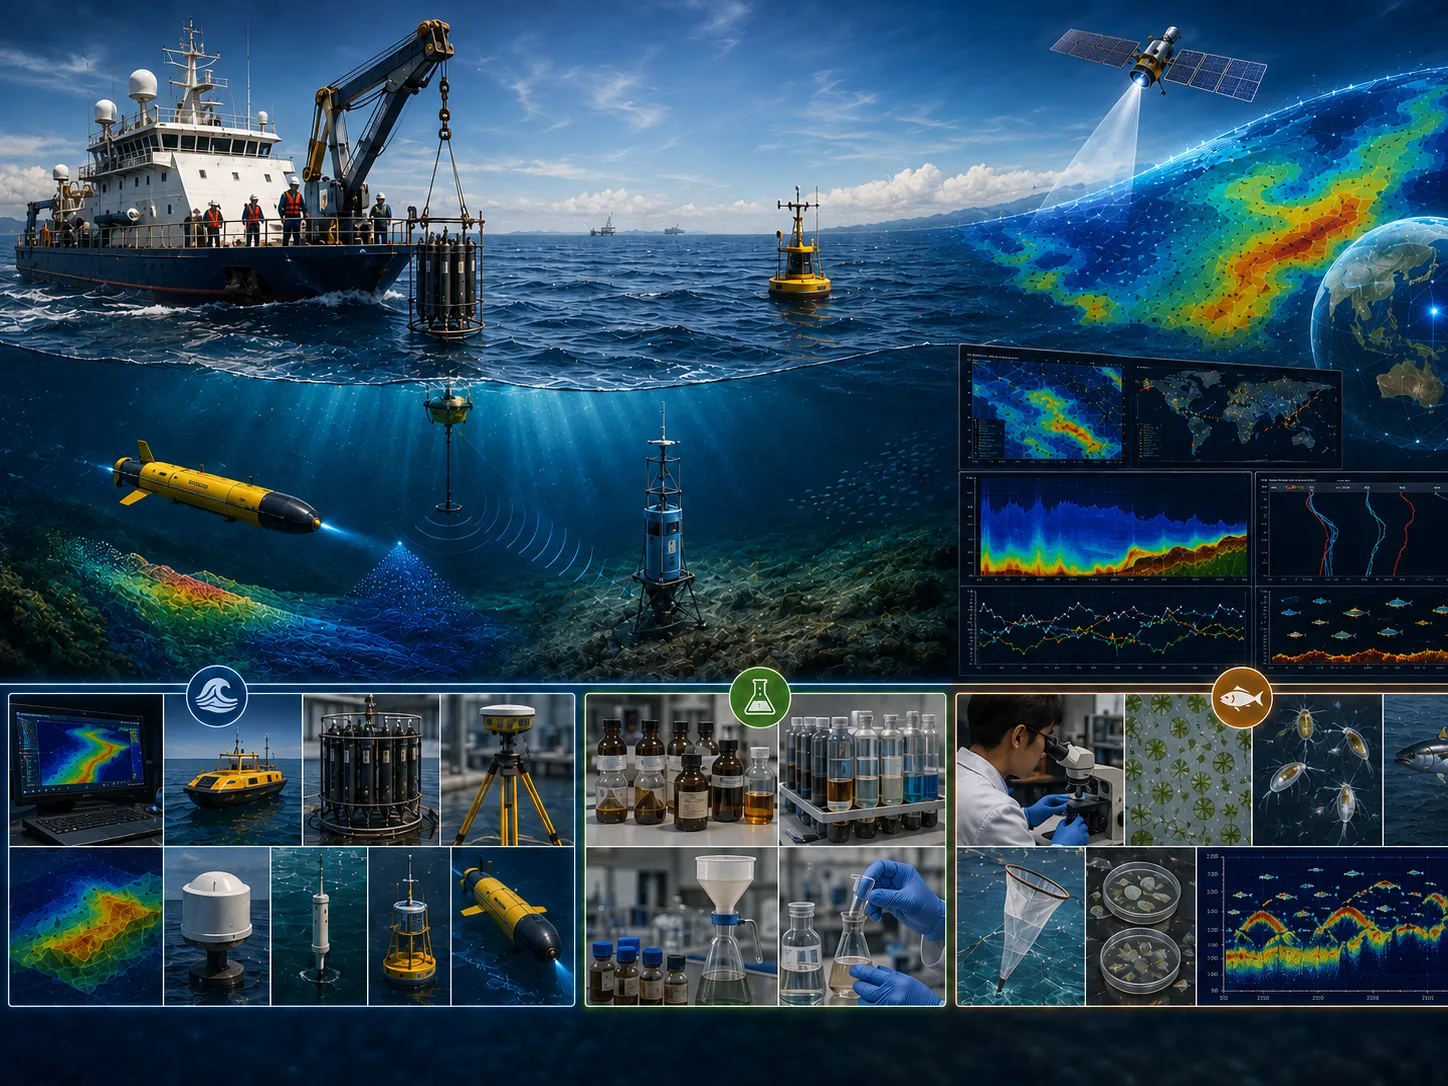
Modeling developed for coastal waters requires careful preparation of modeling scenarios, as well as the data and parameters needed as model inputs. Coastal water dynamics are highly complex and have high variability. The quality and quantity of field data acquisition in coastal waters are highly important for the verification and validation of the model to be developed.
Various tools and instruments are provided with specific types and specifications suitable for coastal waters. These tools and instruments are grouped based on the parameters to be measured, as follows:
A comprehensive survey of coastal characteristics, including shoreline conditions, sand grain characteristics, land cover, coastal vegetation, beach profiles, and other related features.
A survey of seawater depth using portable survey equipment and small boats, specifically for shallow waters where the effects of waves and tides need to be considered.
The CORZ team will review the objective, scope, data availability, risk level, schedule, and required outputs to prepare a proportionate approach.
Share the location, objectives, key challenges, available data, and expected outputs. The CORZ team will help define a proportionate technical approach.