
CONTEXTField conditions and systems being assessed
Enter at least two characters.
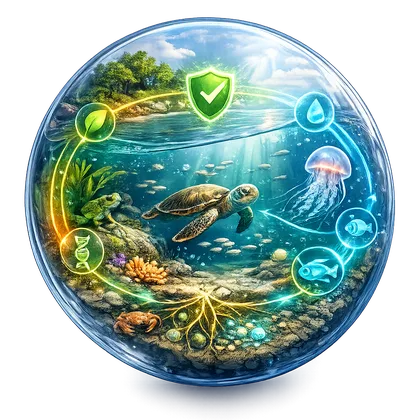
The quality of an aquatic ecosystem is considered high when it is supported by a complete and well-balanced ecological community.
This page includes a one-page leaflet that can be opened in a full-image popup. It helps present the core CORZ service clearly and convincingly during project discussions, executive briefings, and decision-support meetings.
With a more proportional balance between visuals and text, the page feels brighter and more energetic while still keeping the important technical context visible and easy to understand.
Use this leaflet as a concise visual entry point before moving into the more detailed technical explanation.

Clarity before a decision is made
The quality of an aquatic ecosystem is considered high when it is supported by a complete and well-balanced ecological community.
Numerical modeling enables the development of customized simulation scenarios based on variations in physical, chemical, and biological parameters within aquatic environments. By representing ecosystem processes through integrated modeling scenarios, potential disturbances can be systematically introduced and evaluated to understand how the ecological community responds under different environmental conditions.
Define the approach, priorities, and actions for ecosystem quality using traceable evidence.
Environmental impact, design failure, operational disruption, uncontrolled cost, and weak assumptions.
Comparable options, quantified risk, and implementable recommendations.
This aspect is assessed to clarify its implications for ecosystem quality.
This aspect is assessed to clarify its implications for ecosystem quality.
This aspect is assessed to clarify its implications for ecosystem quality.

This aspect is assessed to clarify its implications for ecosystem quality.

This aspect is assessed to clarify its implications for ecosystem quality.

This aspect is assessed to clarify its implications for ecosystem quality.

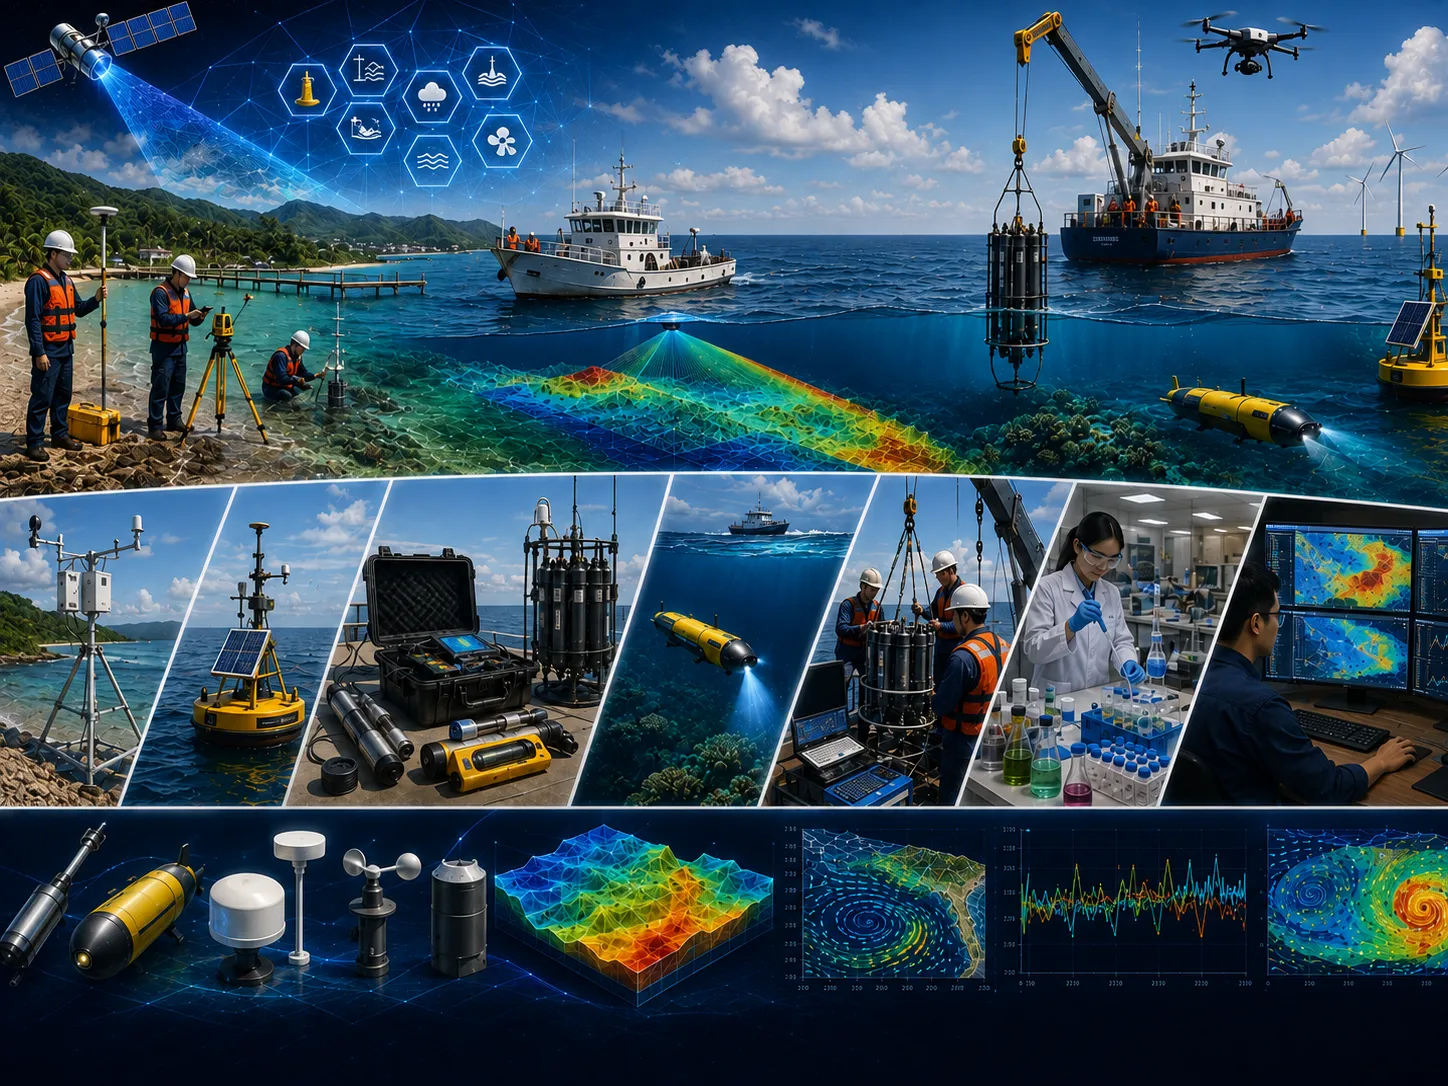
Field surveys, in-situ measurements, laboratory results, historical records, and operating information as required.
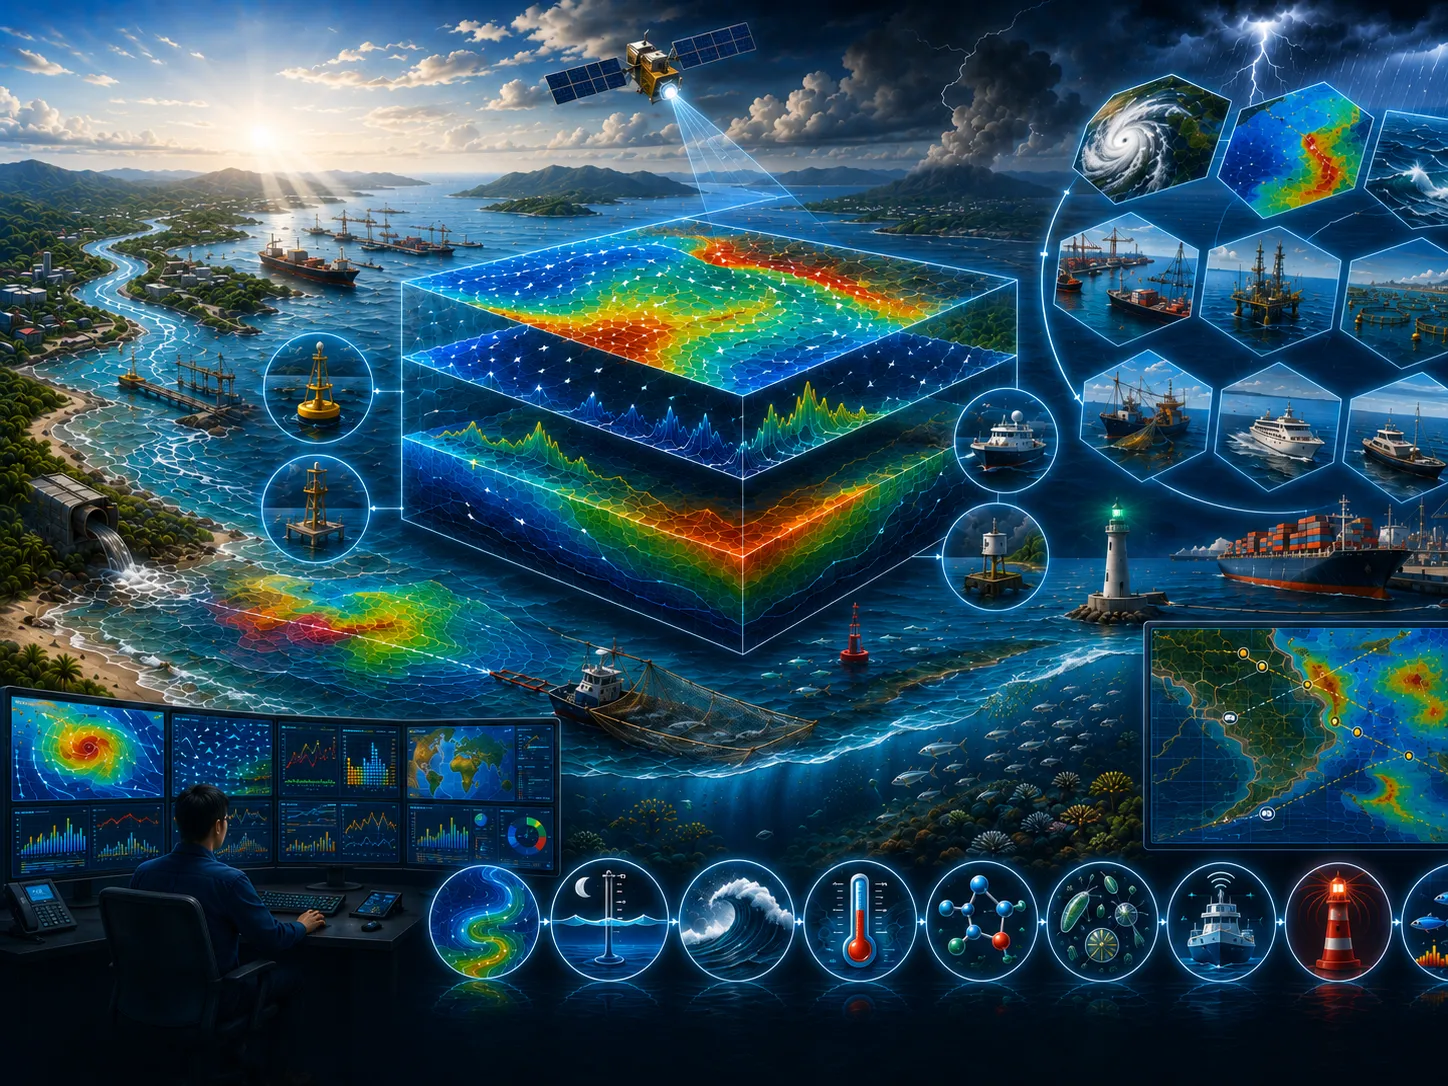
Satellite imagery, mapping, spatial analysis, temporal change, and integration of multiple data sources.
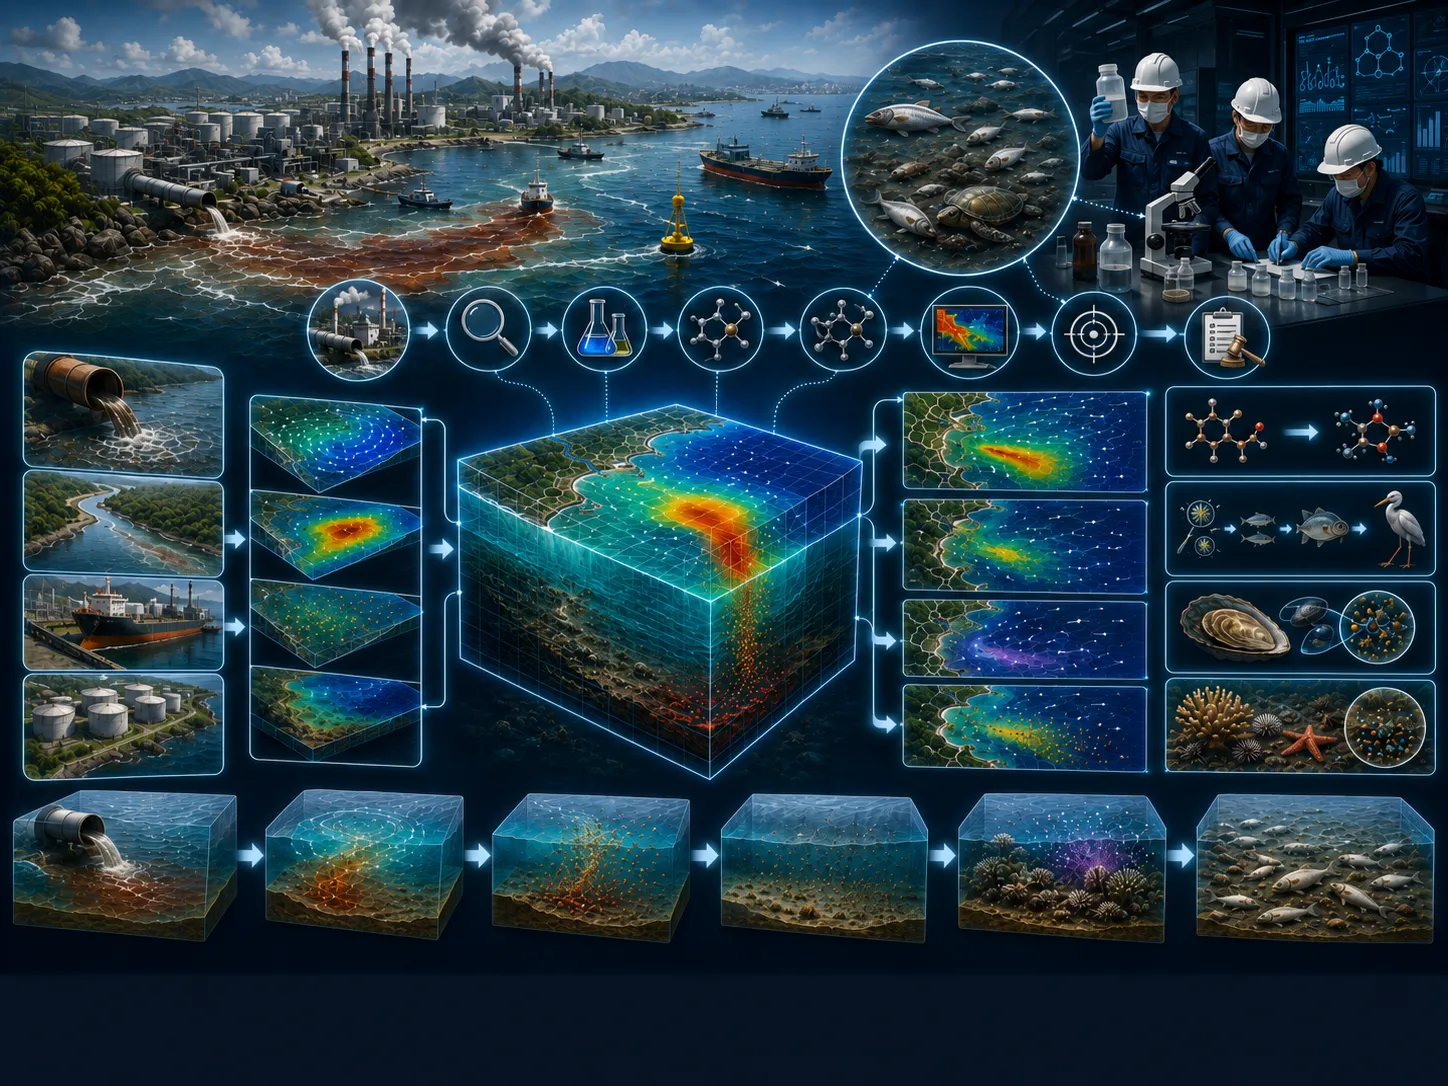
Model setup, calibration, validation, existing–planned–extreme scenarios, and sensitivity analysis.
Metadata, quality controls, assumptions, limitations, data versions, and processing lineage are documented.
Objectives, study area, available data, additional needs, initial risks, and recommended level of detail.
Quality-controlled data, thematic maps, time series, indicators, and comparable visualizations.
Comparison of existing conditions, alternatives, extremes, sensitivities, consequences, and mitigation options.
Methods, results, limitations, recommendations, action priorities, and stakeholder presentation materials.
Assumptions, data, variability, and limitations are stated so decision risk is not hidden.
Alternative locations, designs, operations, or policies are assessed using consistent indicators.
Data needs and analysis depth are proportionate to risk so resources are used efficiently.
Findings and recommendations are transparent for technical, management, regulatory, and partner review.
Objectives, users, location, project phase, problems, constraints, and the decision to support.
Methods, data, surveys, models, schedule, team, deliverables, review gates, and resource estimate.
Collection, inspection, harmonization, documentation, and data-sufficiency assessment.
Processing, modeling, validation, option comparison, sensitivity, and risk evaluation.
Maps, report, executive brief, presentation, supporting data, and follow-up plan.
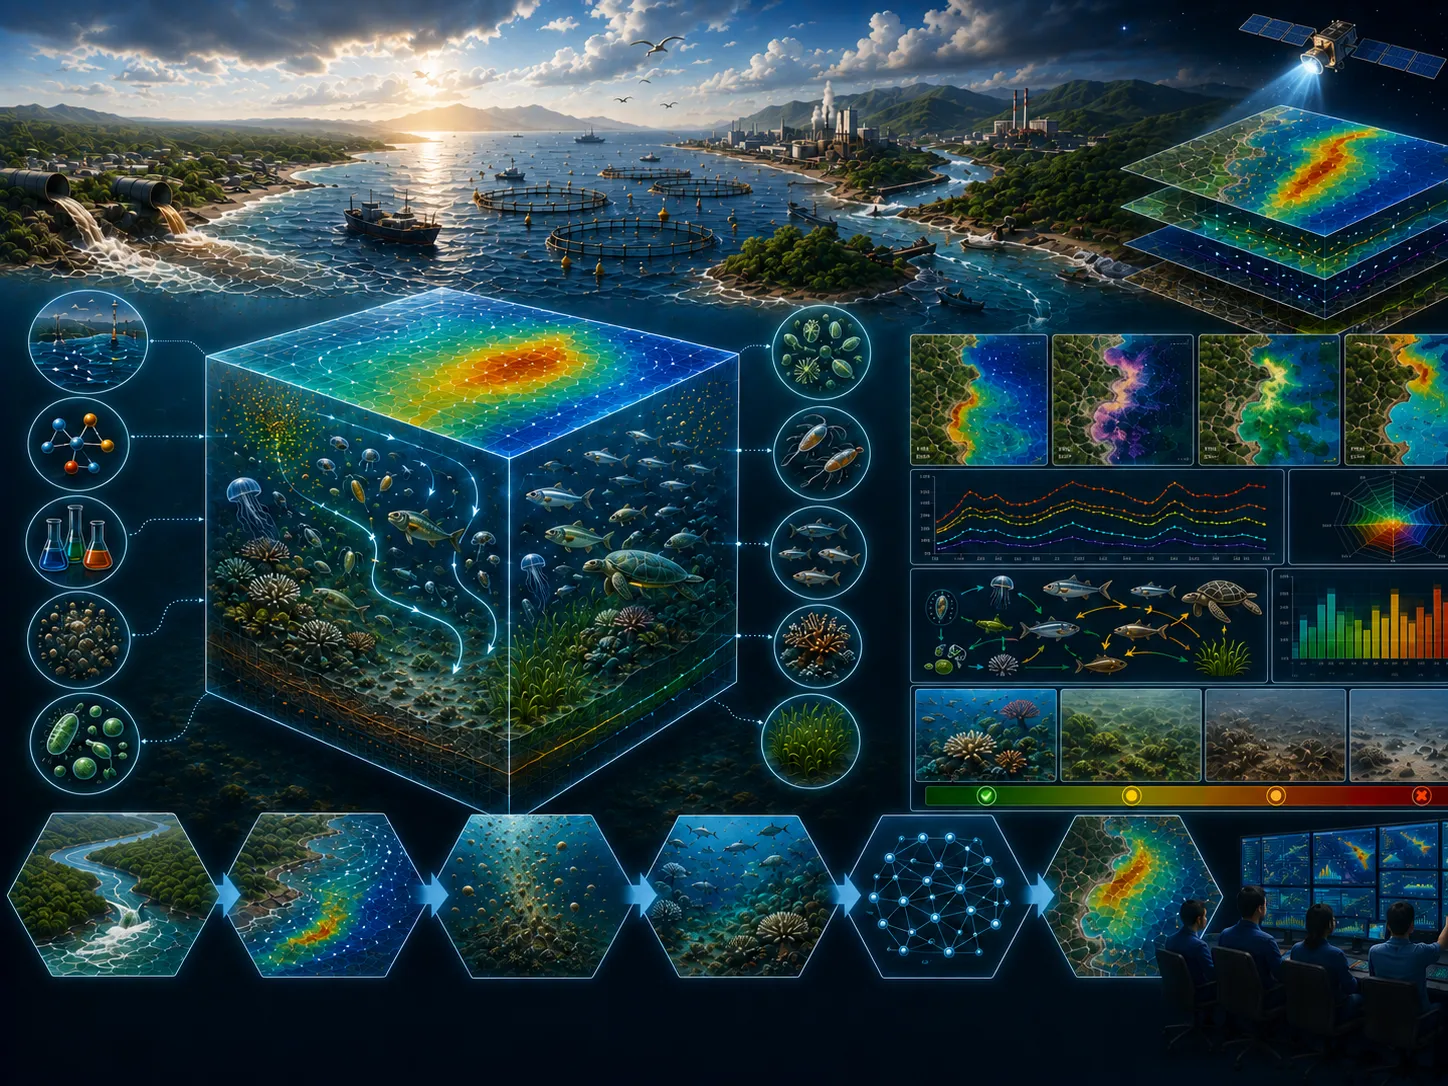
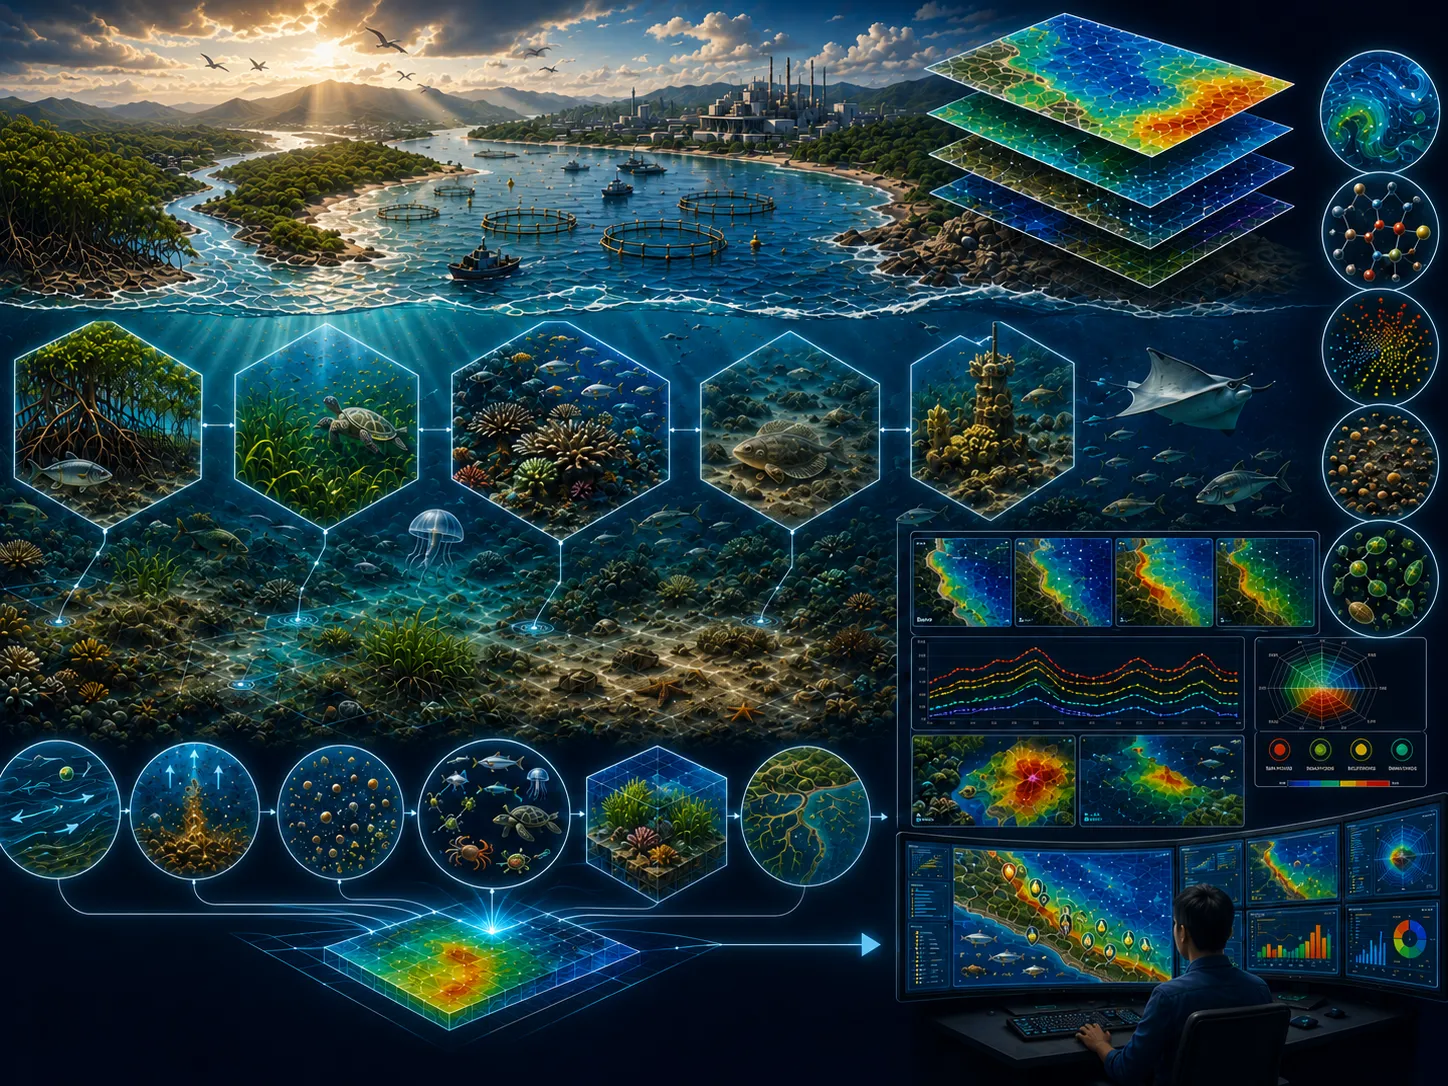
The quality of an aquatic ecosystem is considered high when it is supported by a complete and well-balanced ecological community. A complete community structure promotes ecosystem stability, allowing ecological processes and ecosystem functions to operate efficiently and sustainably. Detecting disturbances within aquatic ecosystems is inherently challenging because aquatic environments are highly dynamic, with continuous interactions among physical, chemical, and biological processes. These rapidly changing conditions can be effectively analyzed through advanced numerical modeling technologies.
Numerical modeling enables the development of customized simulation scenarios based on variations in physical, chemical, and biological parameters within aquatic environments. By representing ecosystem processes through integrated modeling scenarios, potential disturbances can be systematically introduced and evaluated to understand how the ecological community responds under different environmental conditions. If simulation results demonstrate that ecosystem stability is maintained across multiple scenarios, the ecosystem can be considered to possess high ecological quality and resilience.
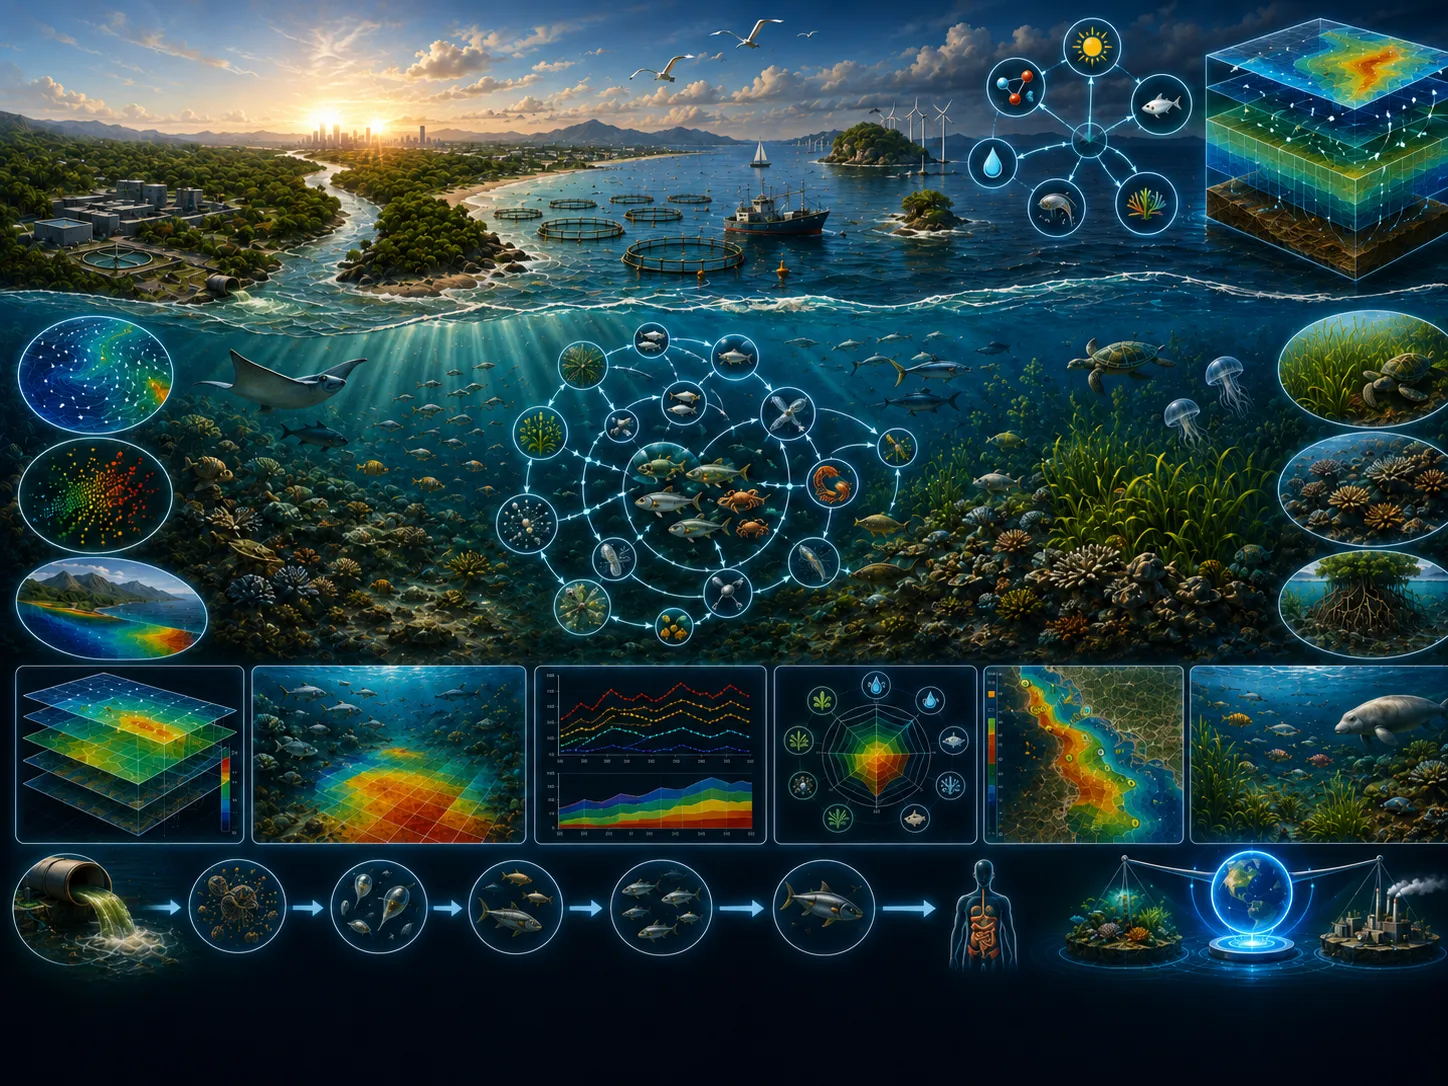
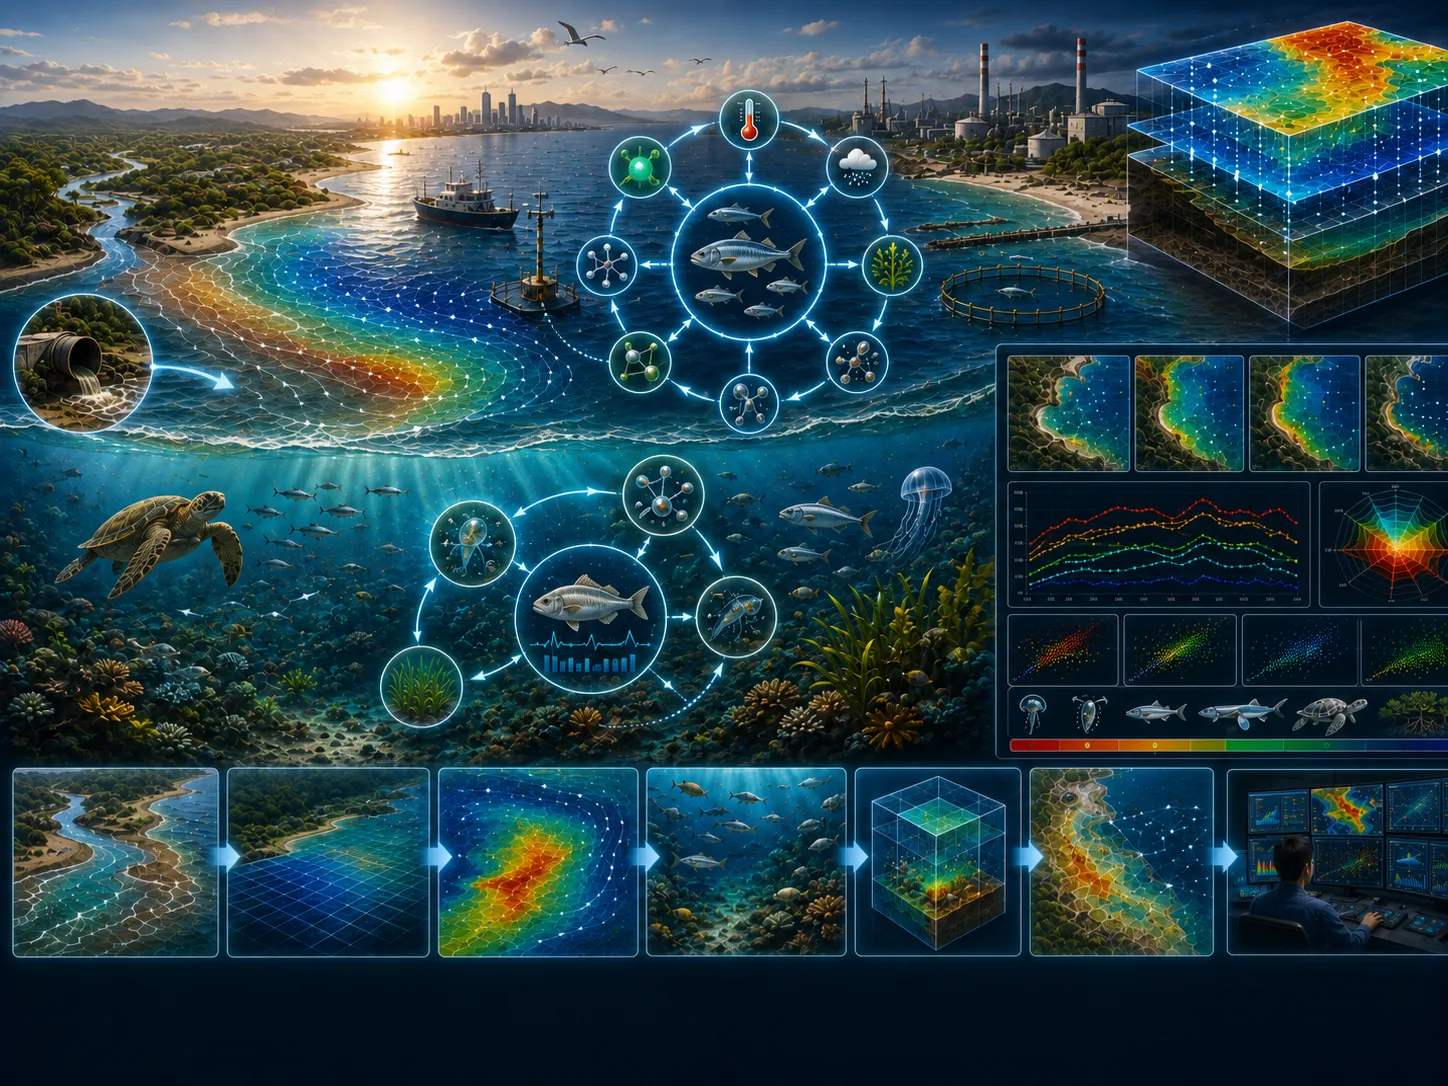
Hydrodynamic modeling is used to analyze current circulation patterns and water level variations and can be integrated with Advection–Dispersion modeling to evaluate the transport and distribution of physical, chemical, and biological constituents. Particle Tracking modeling is applied to assess the movement and fate of suspended materials that may affect water quality and ecosystem health. For coastal and estuarine environments influenced by river inflows, River Flow modeling provides valuable insights into the transport of freshwater, nutrients, sediments, and other chemical and biological inputs from upstream watersheds. Marine GIS integrates simulation outputs from multiple modeling components with spatial datasets, supporting comprehensive analysis, visualization, and informed decision-making.
This integrated modeling framework provides decision-makers with a scientific basis for assessing ecosystem condition, identifying environmental risks, evaluating management scenarios, and supporting sustainable coastal and marine resource management.
The relationship between the aquatic environment and the organisms that inhabit it is a unique and important area of research.
Learn more →Every marine species occupies a habitat that provides the environmental conditions necessary for its survival, growth, and reproduction.
Learn more →The CORZ team will review the objective, scope, data availability, risk level, schedule, and required outputs to prepare a proportionate approach.
Share the location, objectives, key challenges, available data, and expected outputs. The CORZ team will help define a proportionate technical approach.