

CONTEXTField conditions and systems being assessed
Enter at least two characters.
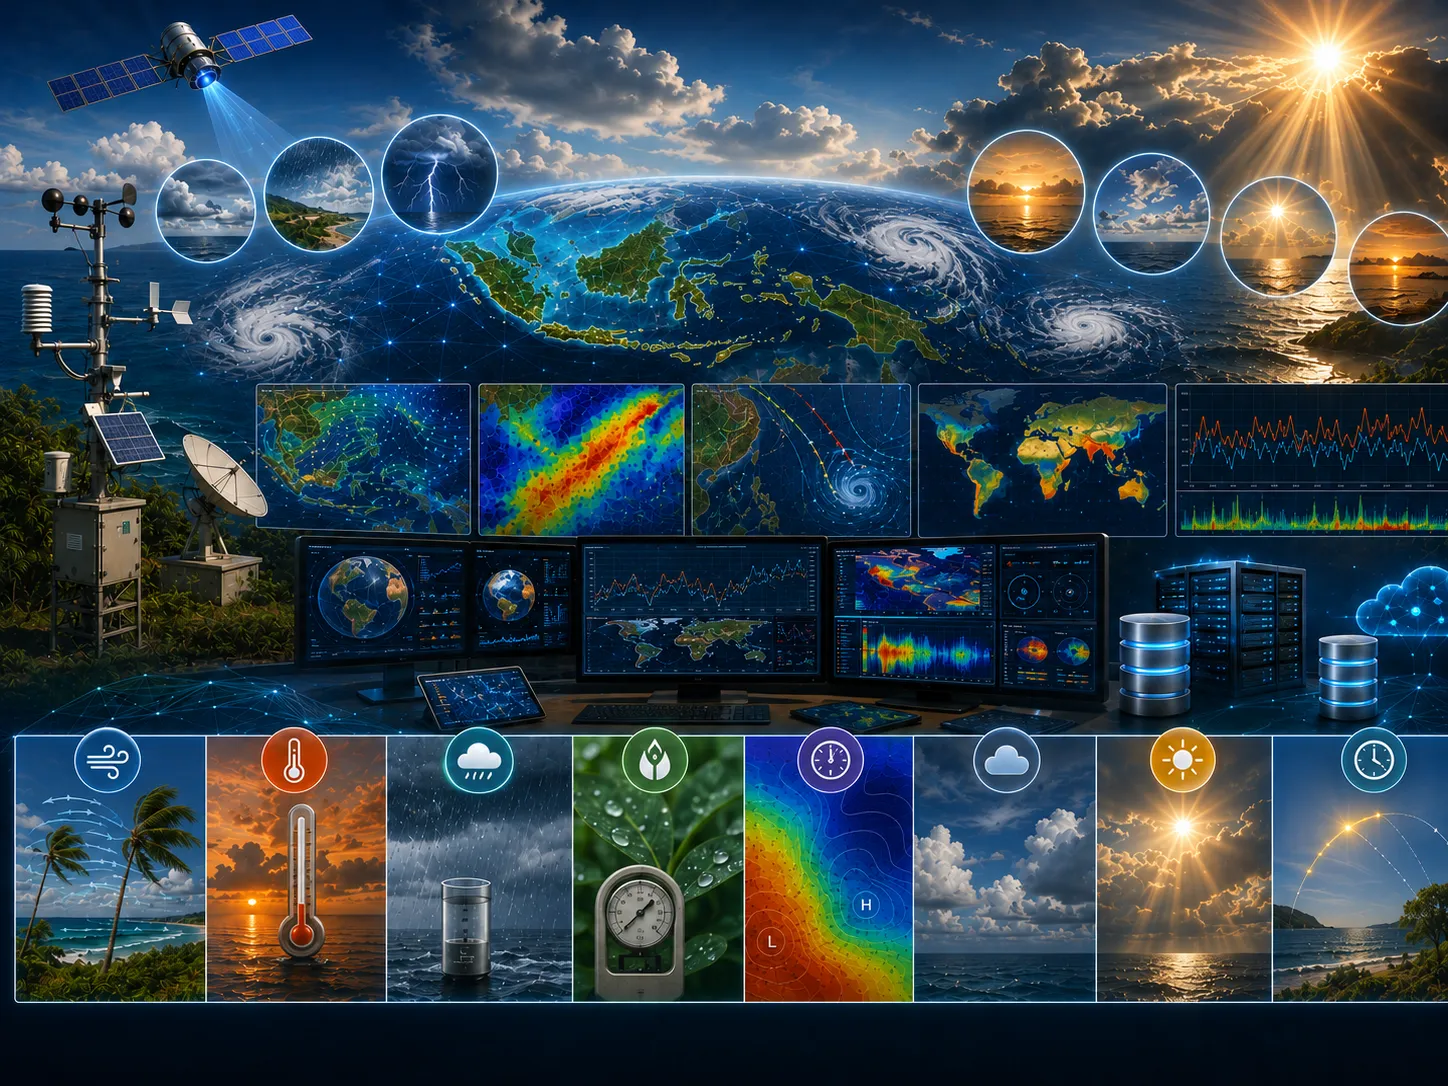
Climate databases are highly needed in modeling as model input data. These databases are useful as one of the driving forces for currents and for representing heat energy exchange between the atmosphere and…
This page includes a one-page leaflet that can be opened in a full-image popup. It helps present the core CORZ service clearly and convincingly during project discussions, executive briefings, and decision-support meetings.
With a more proportional balance between visuals and text, the page feels brighter and more energetic while still keeping the important technical context visible and easy to understand.
Use this leaflet as a concise visual entry point before moving into the more detailed technical explanation.
Clarity before a decision is made
Climate databases are highly needed in modeling as model input data. These databases are useful as one of the driving forces for currents and for representing heat energy exchange between the atmosphere and…
The climate conditions under which a phenomenon occurs play an important role in modeling. For example, when developing a modeling scenario during the maximum phase of the Madden-Julian Oscillation, during a positive Dipole Mode phase, during a negative Southern Oscillation phase, or during a strong west monsoon phase, cloud cover, wind speed, and wind direction over Indonesian waters will differ for each phenomenon.
Define the approach, priorities, and actions for climate using traceable evidence.
Mismatched resolution, period, variable definition, quality, and use licensing.
Documented, consistent, traceable datasets fit for purpose.
This aspect is assessed to clarify its implications for climate.
This aspect is assessed to clarify its implications for climate.
This aspect is assessed to clarify its implications for climate.

This aspect is assessed to clarify its implications for climate.
This aspect is assessed to clarify its implications for climate.

This aspect is assessed to clarify its implications for climate.
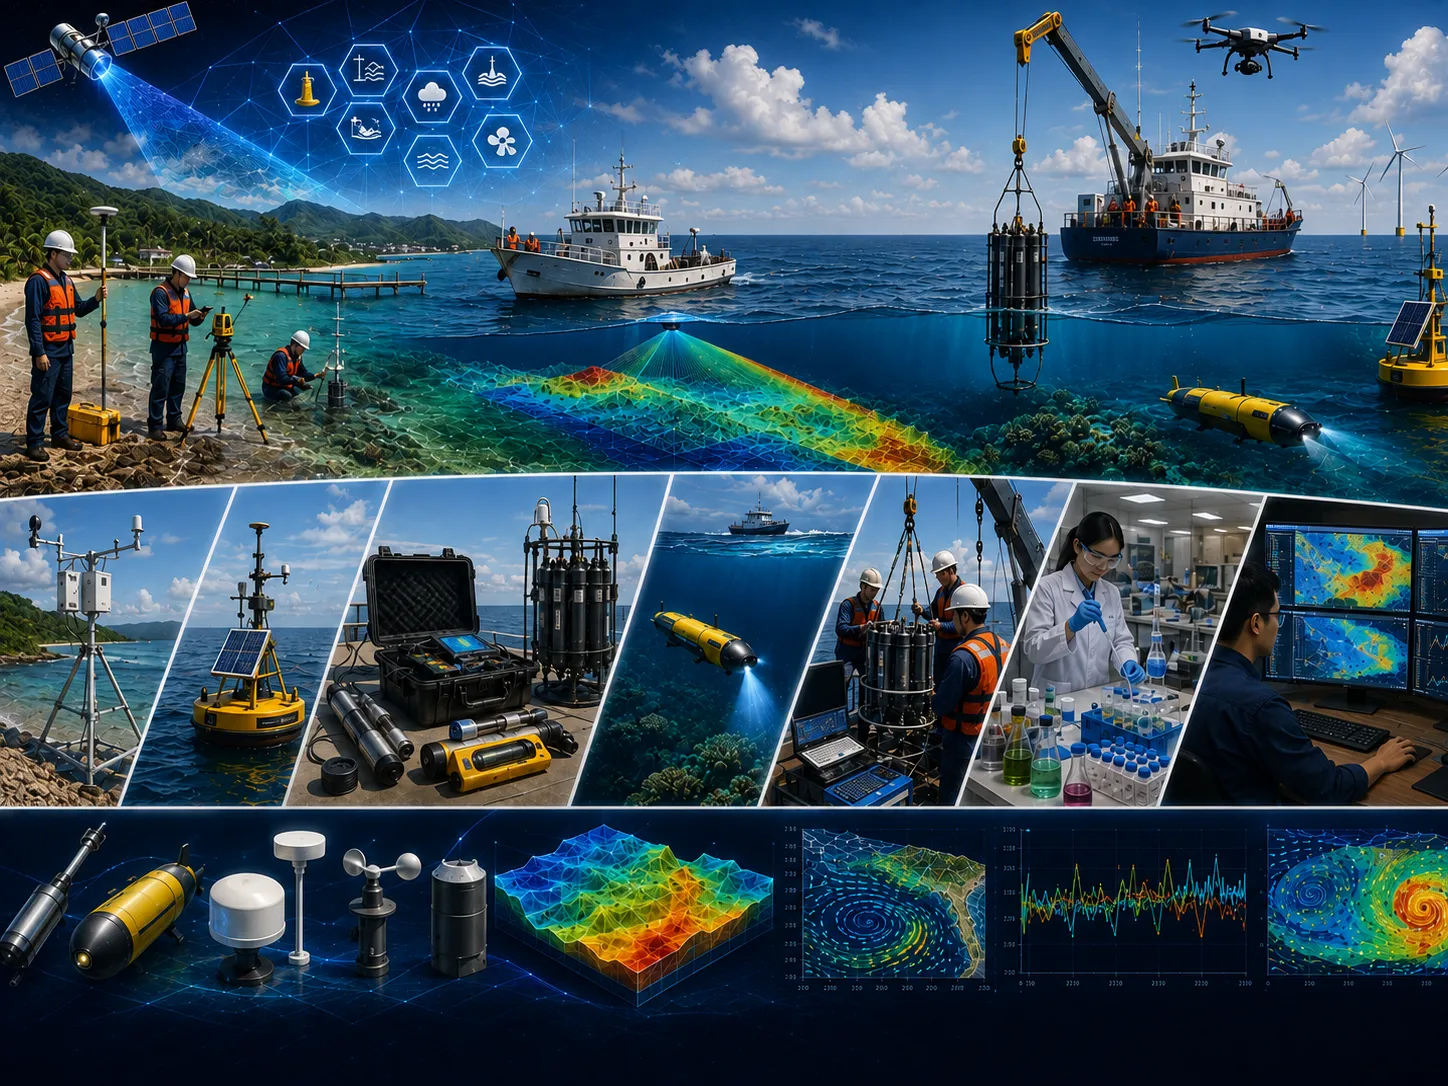
Field surveys, in-situ measurements, laboratory results, historical records, and operating information as required.
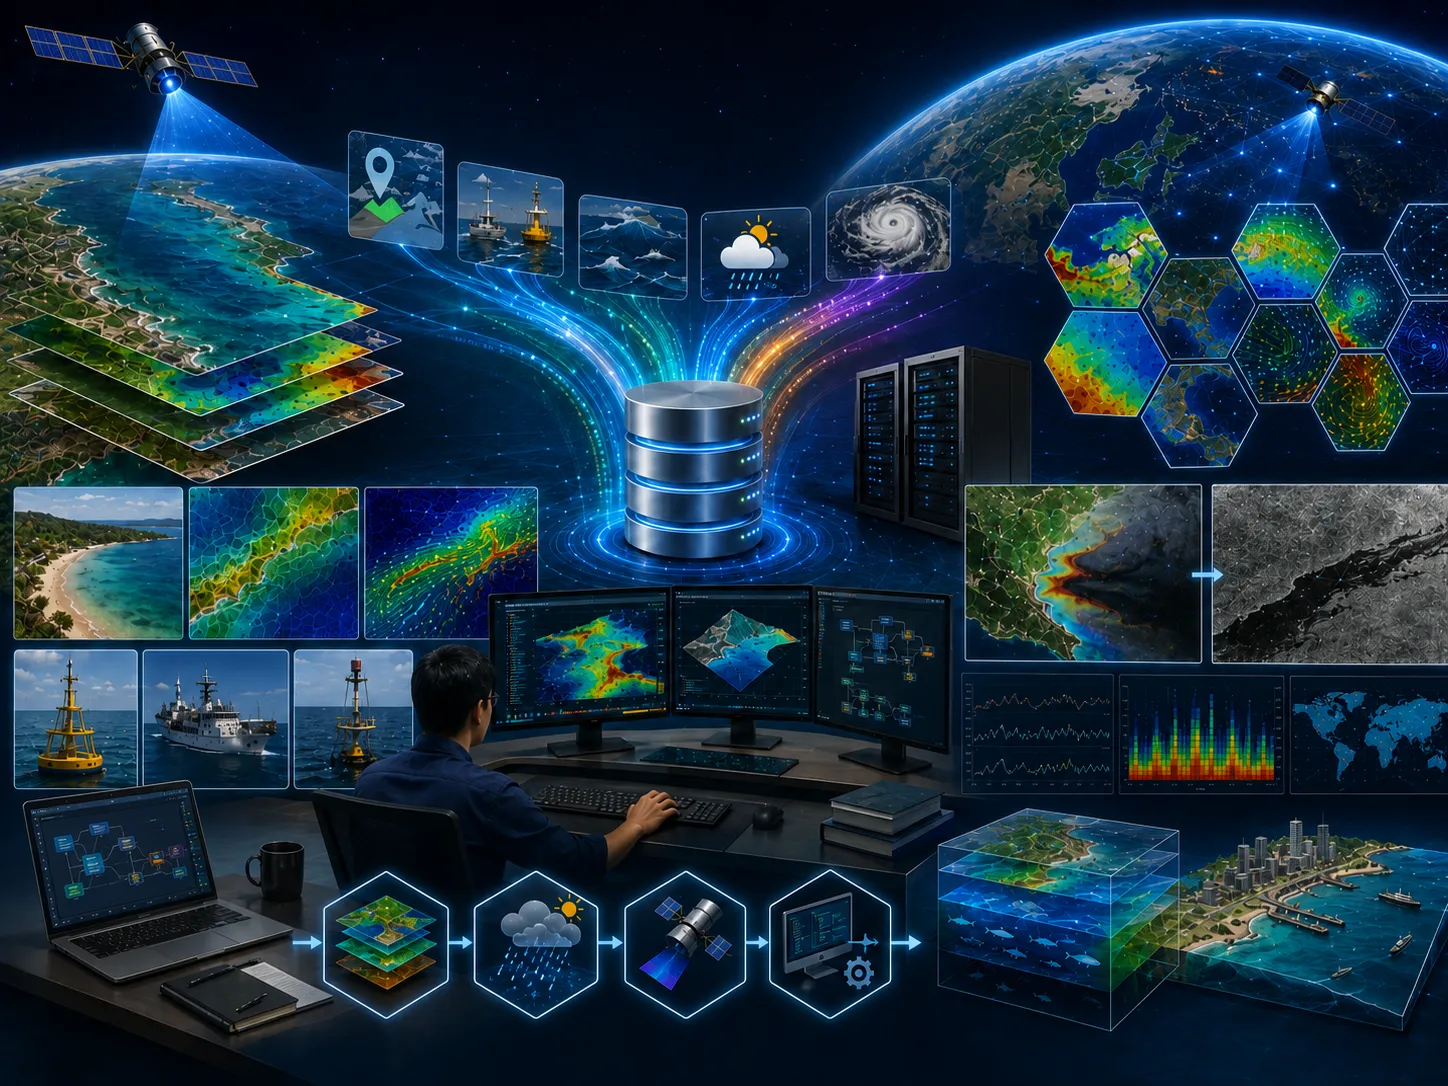
Satellite imagery, mapping, spatial analysis, temporal change, and integration of multiple data sources.
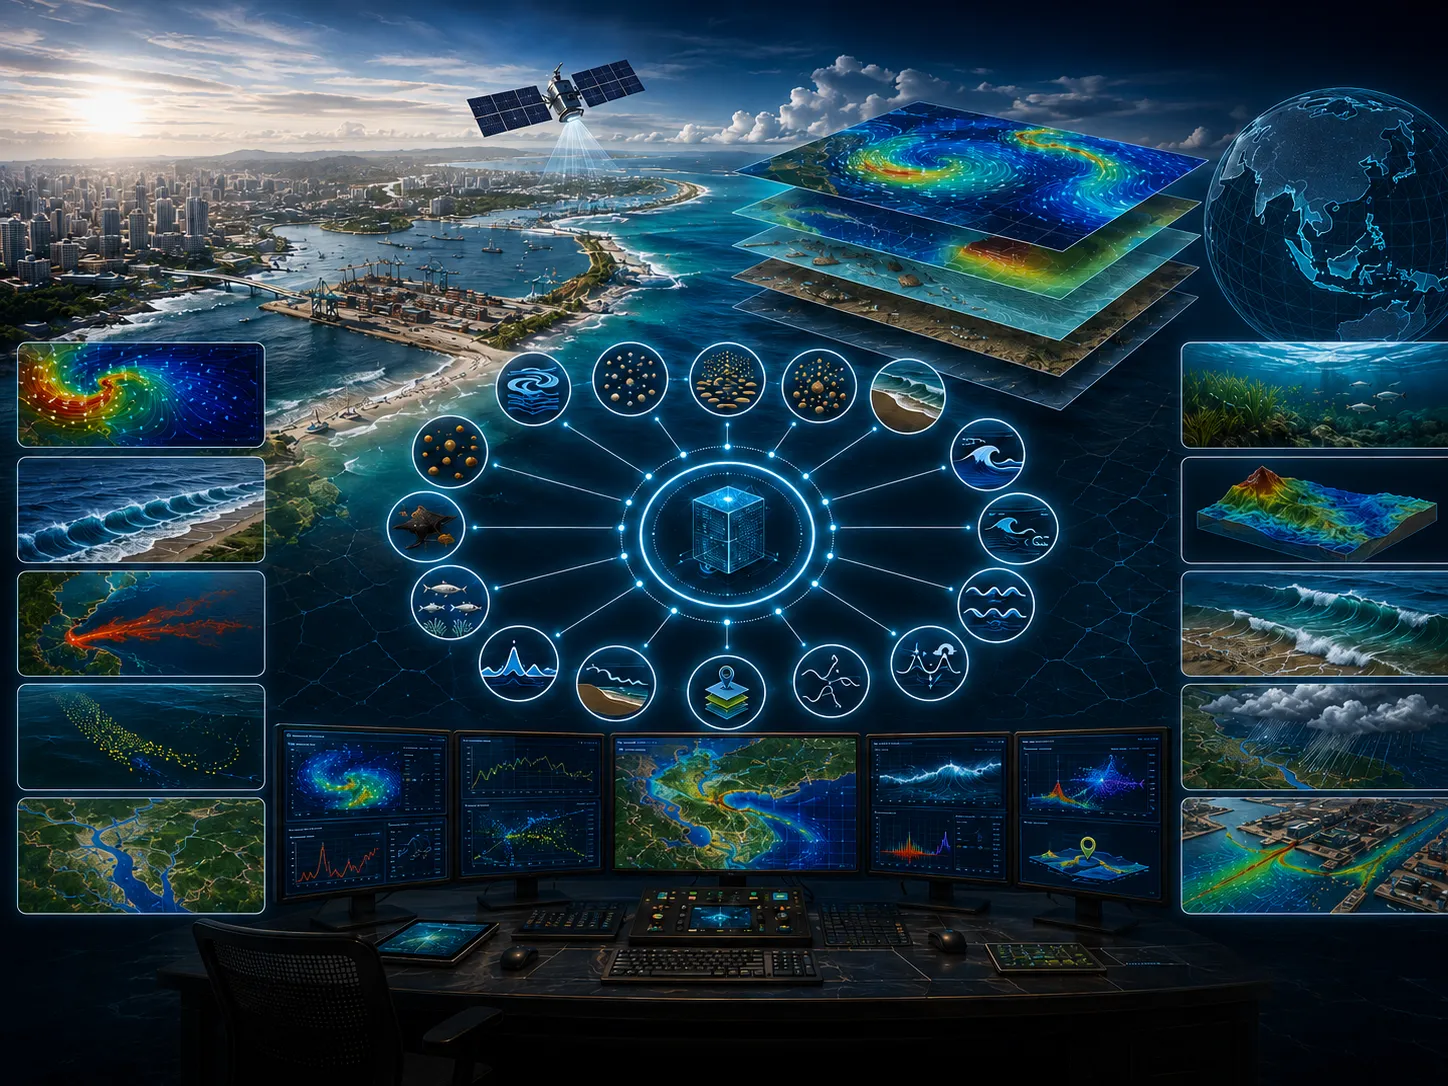
Model setup, calibration, validation, existing–planned–extreme scenarios, and sensitivity analysis.
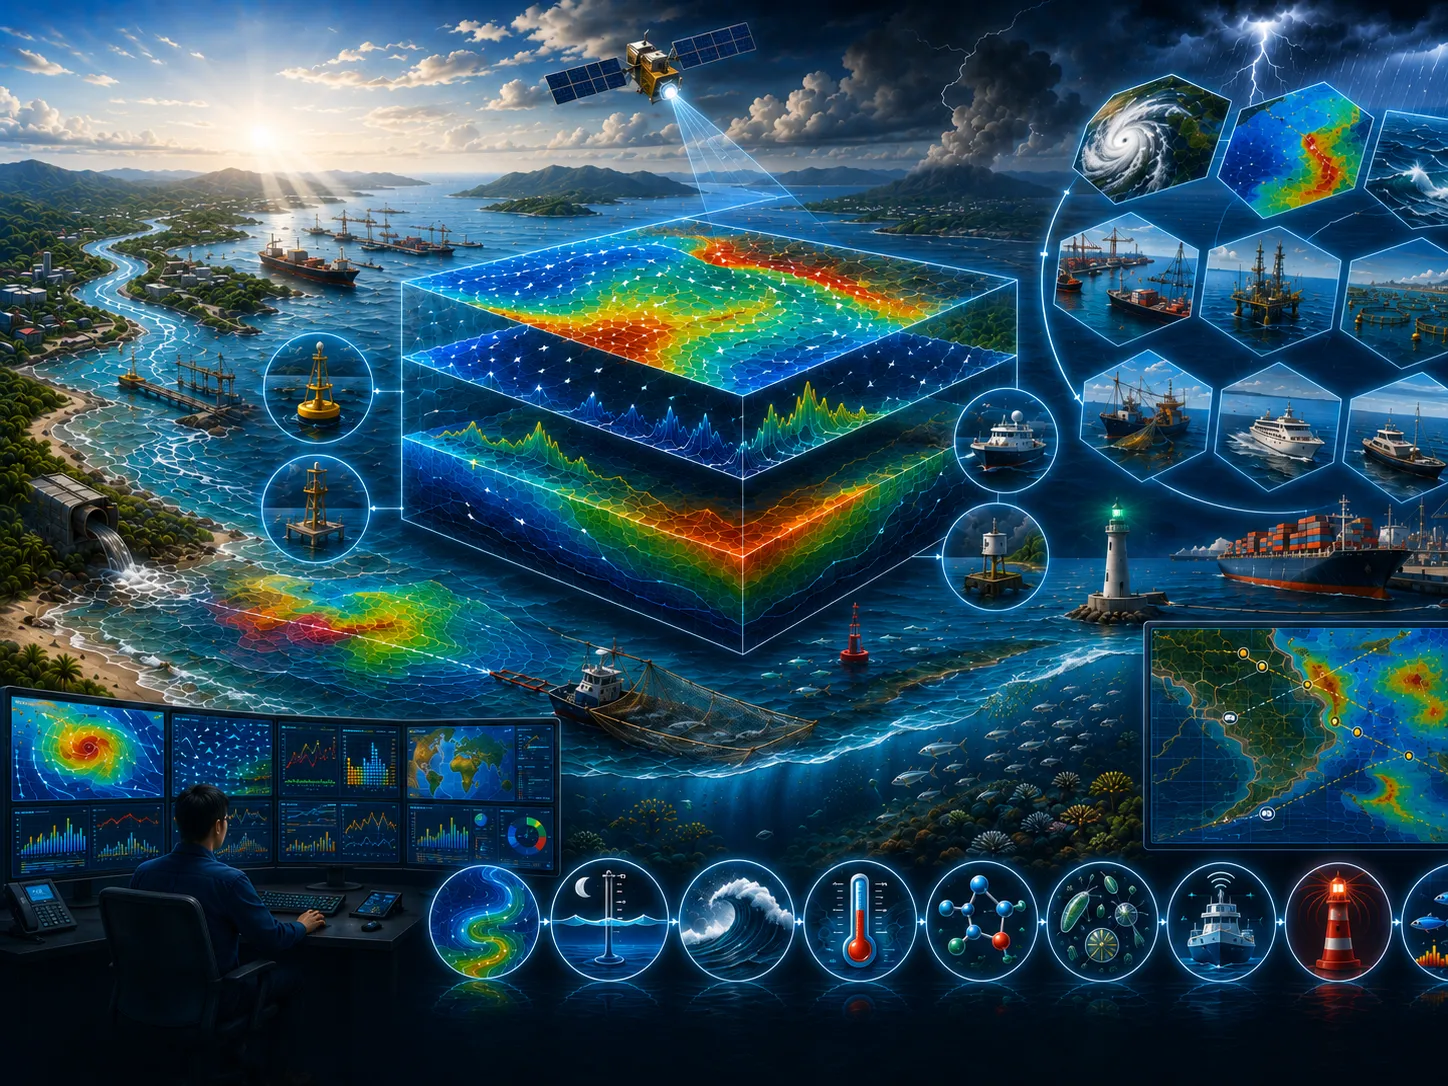
Metadata, quality controls, assumptions, limitations, data versions, and processing lineage are documented.
Objectives, study area, available data, additional needs, initial risks, and recommended level of detail.
Quality-controlled data, thematic maps, time series, indicators, and comparable visualizations.
Comparison of existing conditions, alternatives, extremes, sensitivities, consequences, and mitigation options.
Methods, results, limitations, recommendations, action priorities, and stakeholder presentation materials.
Assumptions, data, variability, and limitations are stated so decision risk is not hidden.
Alternative locations, designs, operations, or policies are assessed using consistent indicators.
Data needs and analysis depth are proportionate to risk so resources are used efficiently.
Findings and recommendations are transparent for technical, management, regulatory, and partner review.
Objectives, users, location, project phase, problems, constraints, and the decision to support.
Methods, data, surveys, models, schedule, team, deliverables, review gates, and resource estimate.
Collection, inspection, harmonization, documentation, and data-sufficiency assessment.
Processing, modeling, validation, option comparison, sensitivity, and risk evaluation.
Maps, report, executive brief, presentation, supporting data, and follow-up plan.
Climate databases are highly needed in modeling as model input data. These databases are useful as one of the driving forces for currents and for representing heat energy exchange between the atmosphere and the sea surface. Various types of climate datasets are available from national and international research institutions. These databases are useful for modifying modeling scenarios influenced by diurnal, semi-diurnal, daily, monthly, seasonal, intraseasonal, and even interannual phenomena.
The climate conditions under which a phenomenon occurs play an important role in modeling. For example, when developing a modeling scenario during the maximum phase of the Madden-Julian Oscillation, during a positive Dipole Mode phase, during a negative Southern Oscillation phase, or during a strong west monsoon phase, cloud cover, wind speed, and wind direction over Indonesian waters will differ for each phenomenon. The many climate phenomena that occur in Indonesian waters make the modeling process more complex. Therefore, climate databases are essential for modeling in Indonesian waters.
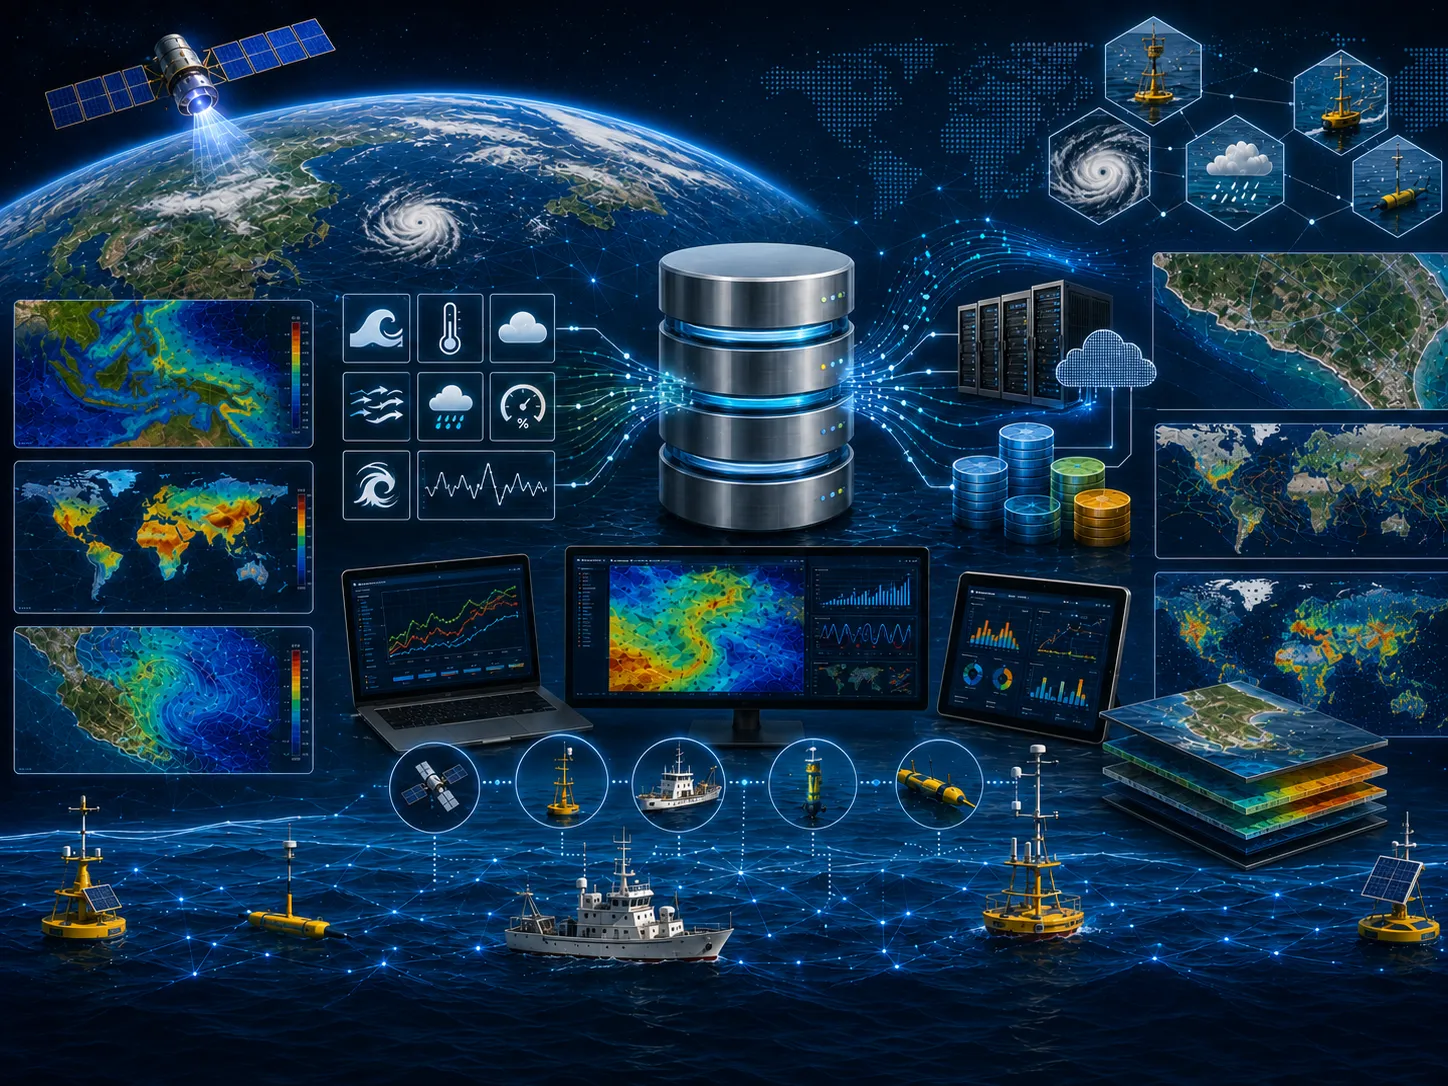
Coastal databases are needed in modeling as model input data. These data include shoreline data, coastal bathymetry, and seabed characteristics. Coastal databases are also useful as additional information…
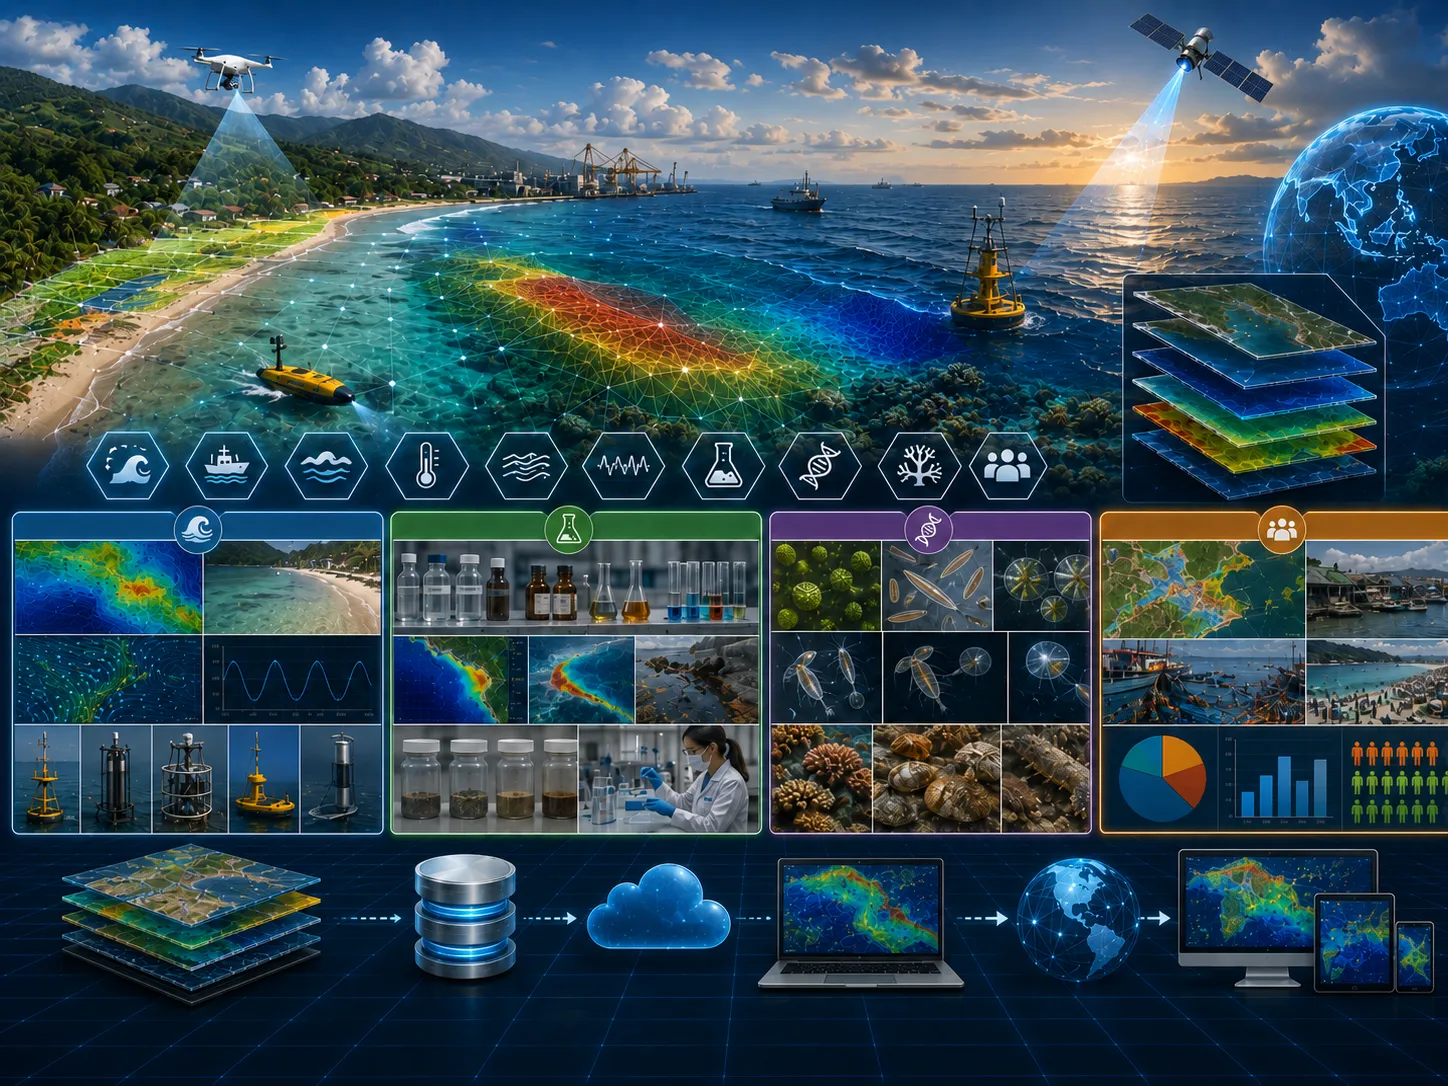
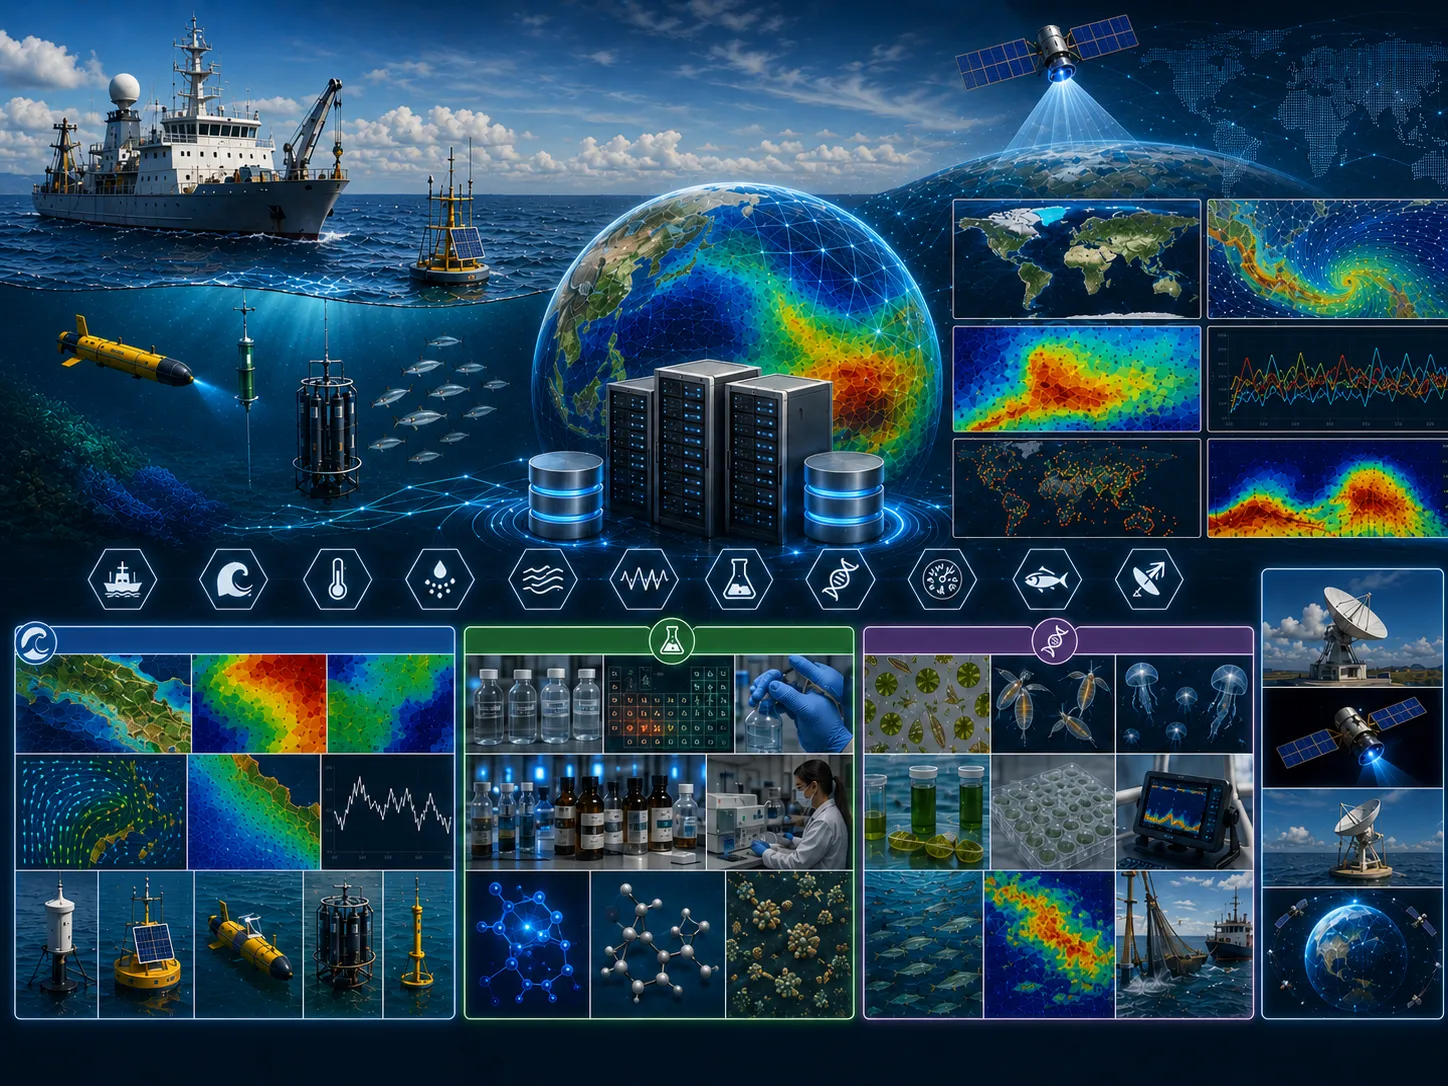
Learn more →Marine databases are needed in modeling. These databases may consist of in situ datasets and reanalysis data produced using various methods, such as data assimilation, optimal interpolation, grid analysis,…
Learn more →The CORZ team will review the objective, scope, data availability, risk level, schedule, and required outputs to prepare a proportionate approach.
Share the location, objectives, key challenges, available data, and expected outputs. The CORZ team will help define a proportionate technical approach.