

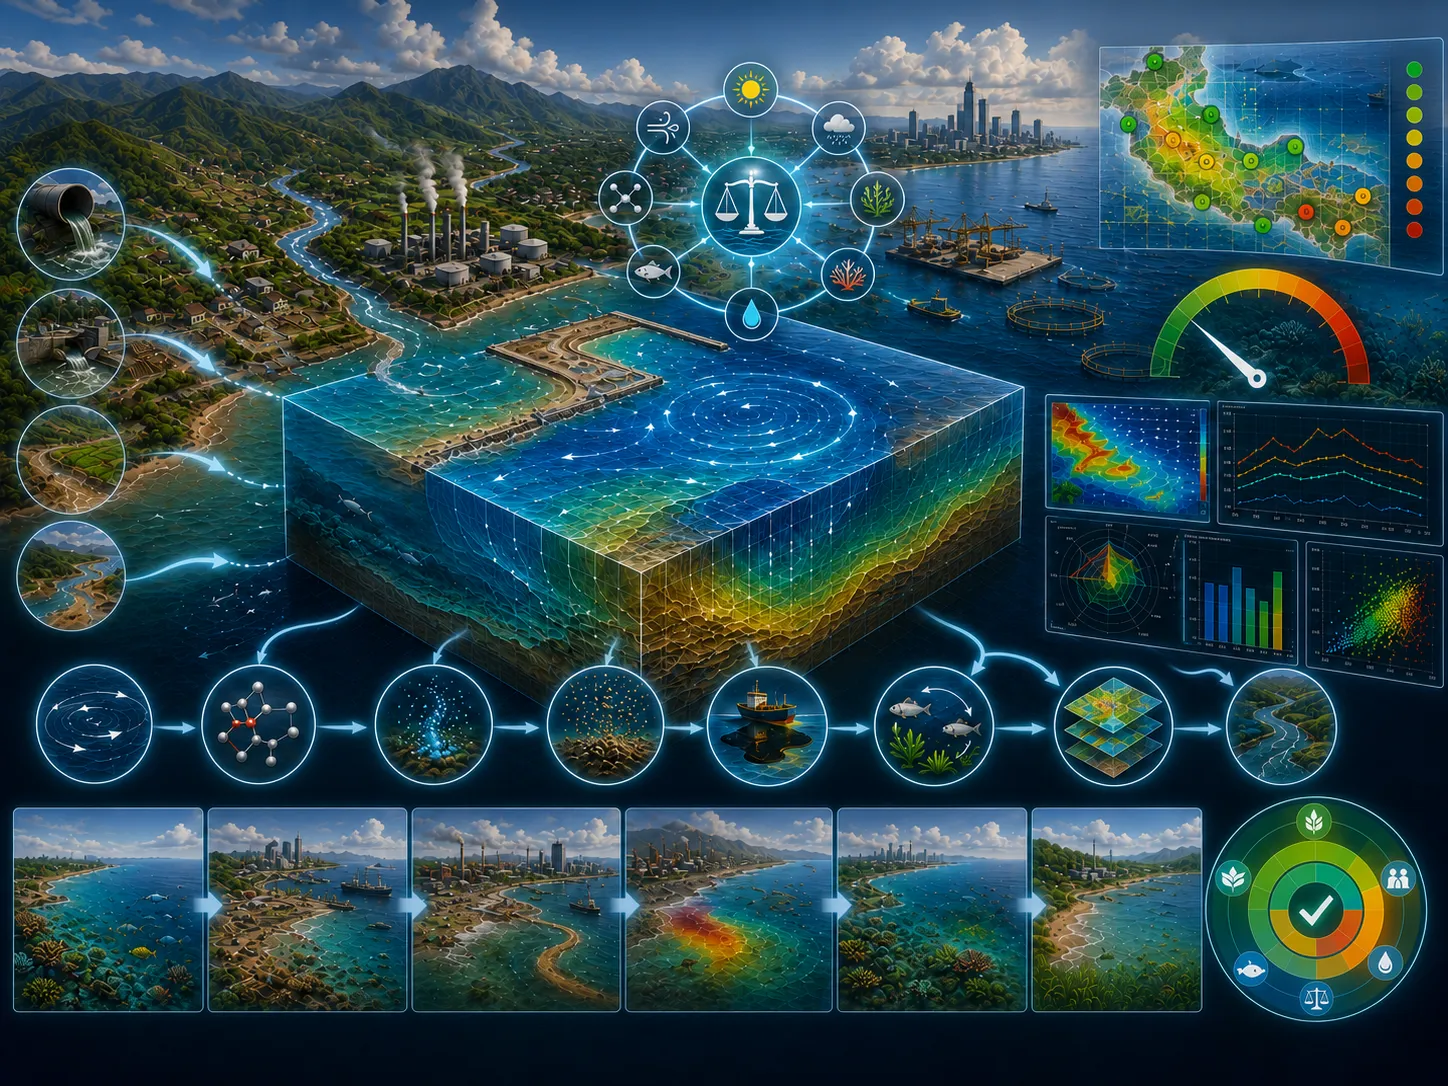
CONTEXTField conditions and systems being assessed
Enter at least two characters.
The aquatic environmental carrying capacity is the ability of a water body to receive a certain load of substances from external sources and naturally neutralize or restore environmental stability within a…
This page includes a one-page leaflet that can be opened in a full-image popup. It helps present the core CORZ service clearly and convincingly during project discussions, executive briefings, and decision-support meetings.
With a more proportional balance between visuals and text, the page feels brighter and more energetic while still keeping the important technical context visible and easy to understand.
Use this leaflet as a concise visual entry point before moving into the more detailed technical explanation.

Clarity before a decision is made
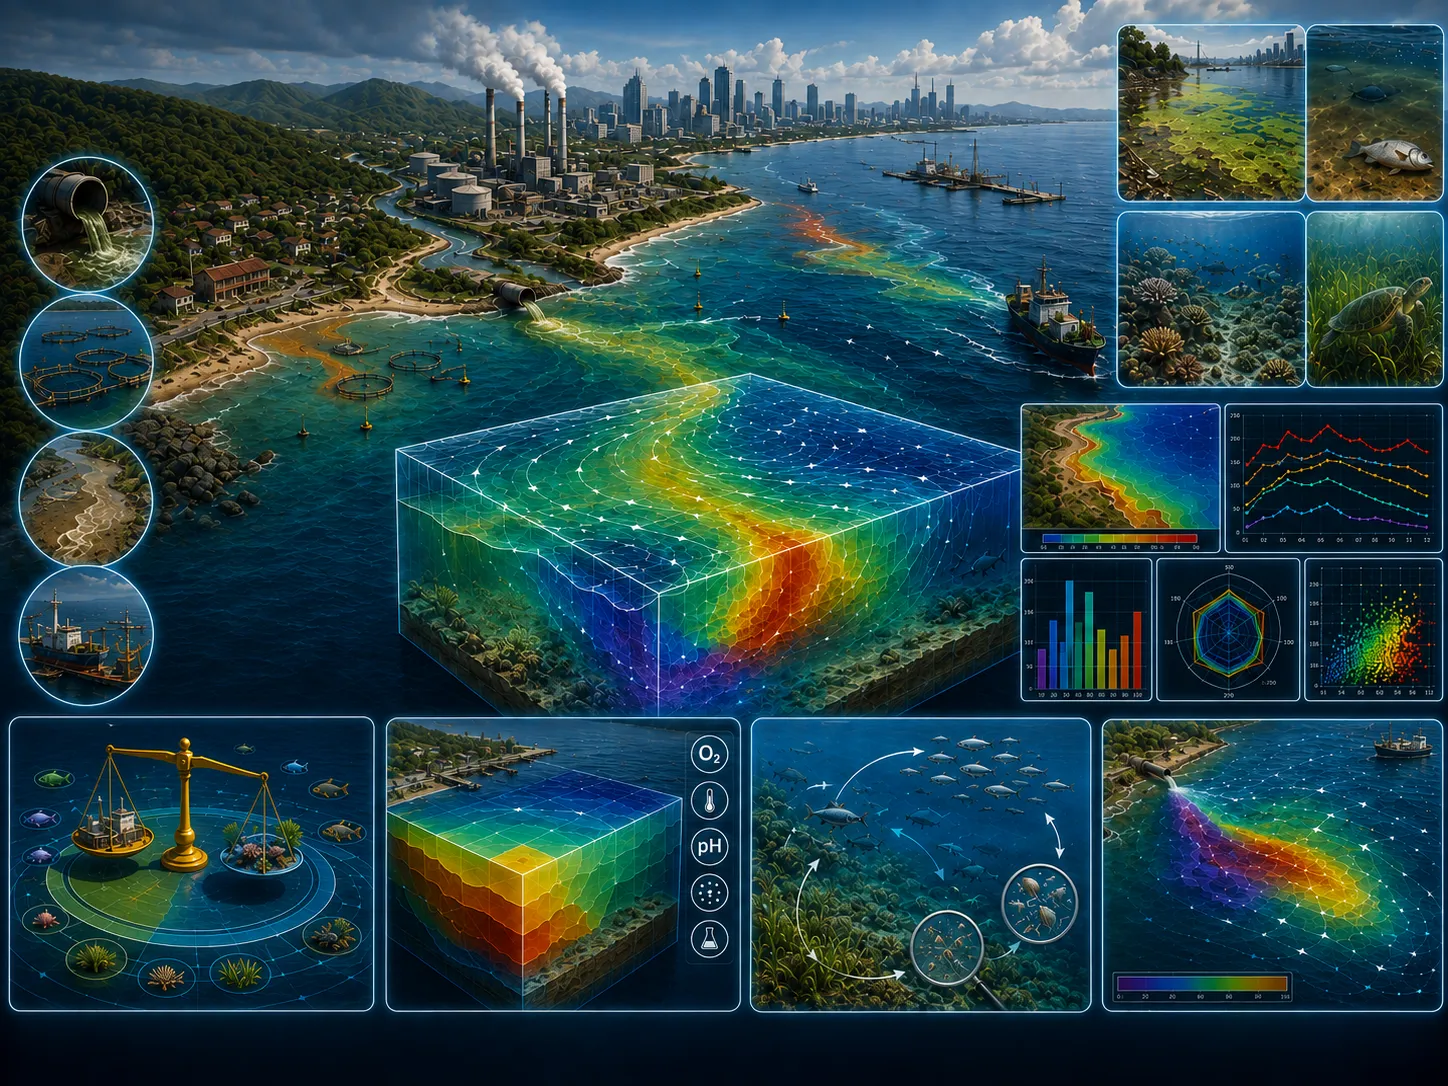
The aquatic environmental carrying capacity is the ability of a water body to receive a certain load of substances from external sources and naturally neutralize or restore environmental stability within a…
Modeling scenarios for evaluating aquatic environmental carrying capacity are generally divided into two categories: natural (pristine) waters and human-impacted waters. For natural waters, modeling begins by characterizing the existing physical, chemical, and biological conditions and identifying the interactions among them.
Define the approach, priorities, and actions for aquatic environmental carrying capacity using traceable evidence.
Environmental impact, design failure, operational disruption, uncontrolled cost, and weak assumptions.
Comparable options, quantified risk, and implementable recommendations.
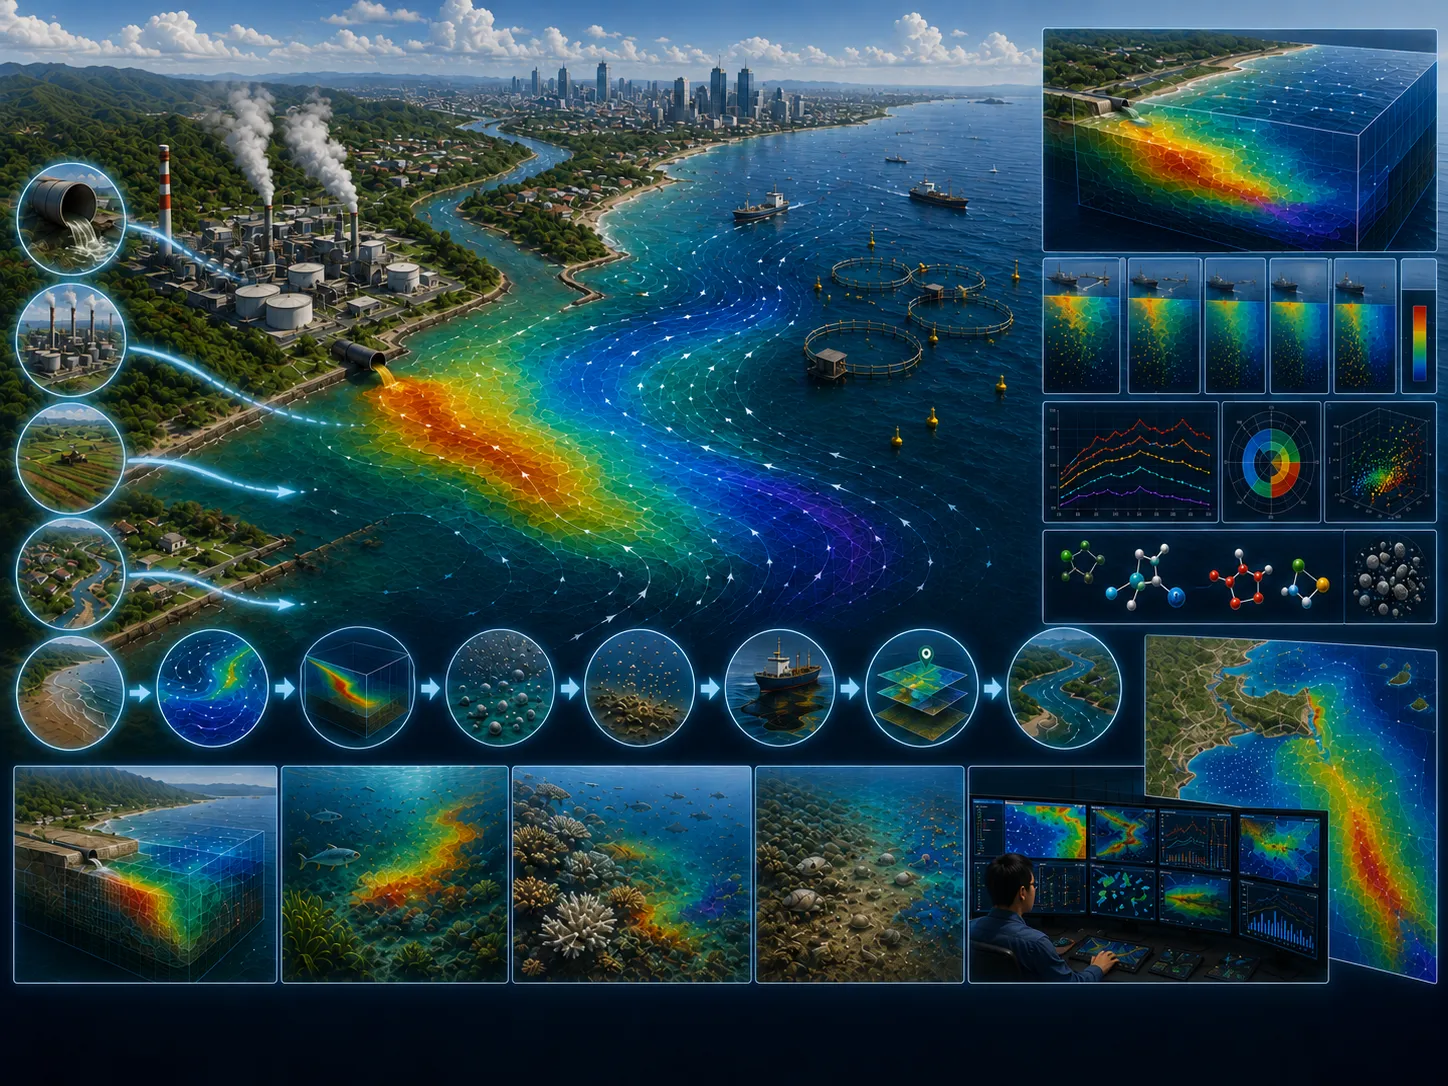
This aspect is assessed to clarify its implications for aquatic environmental carrying capacity.
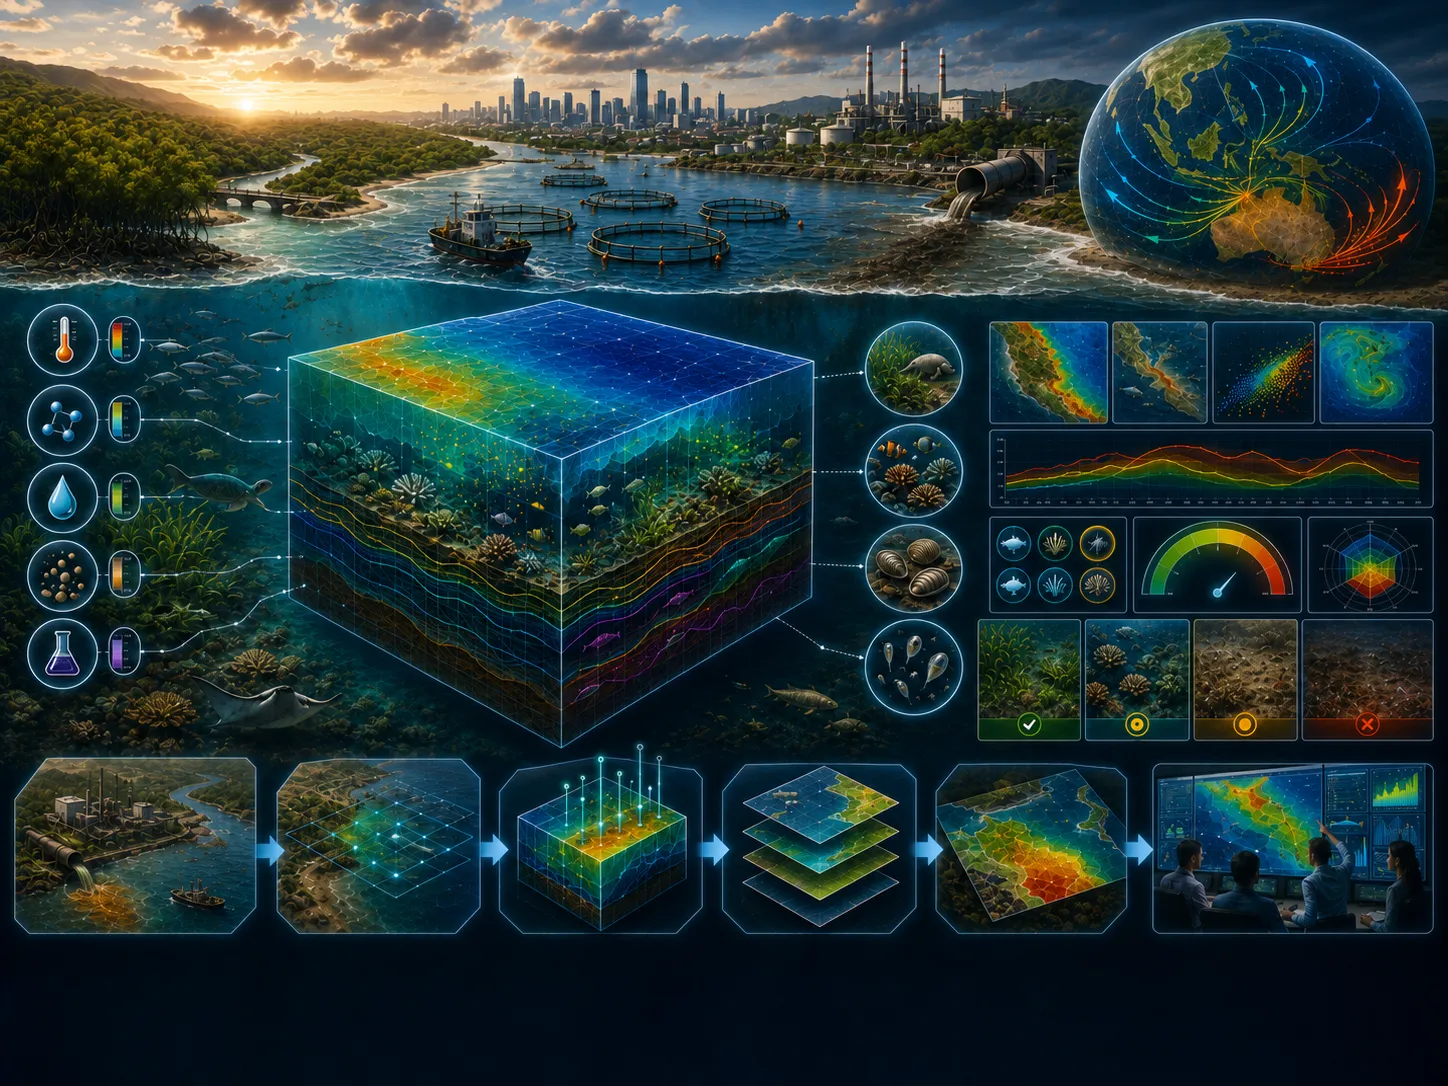
This aspect is assessed to clarify its implications for aquatic environmental carrying capacity.
This aspect is assessed to clarify its implications for aquatic environmental carrying capacity.
This aspect is assessed to clarify its implications for aquatic environmental carrying capacity.

This aspect is assessed to clarify its implications for aquatic environmental carrying capacity.

This aspect is assessed to clarify its implications for aquatic environmental carrying capacity.

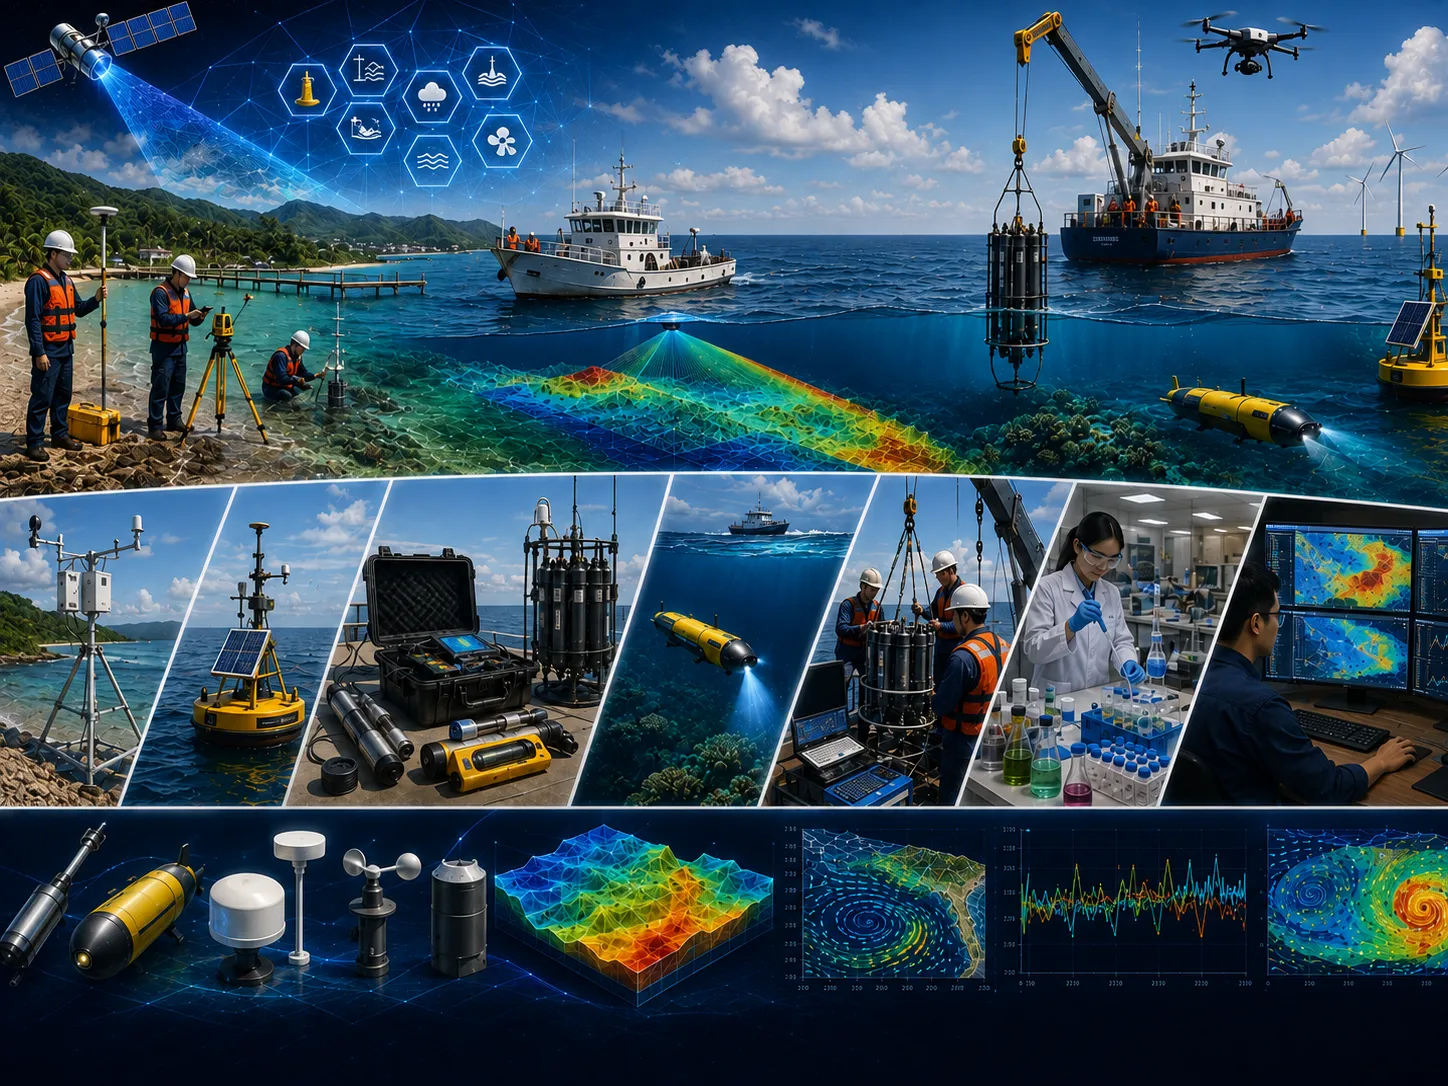
Field surveys, in-situ measurements, laboratory results, historical records, and operating information as required.

Satellite imagery, mapping, spatial analysis, temporal change, and integration of multiple data sources.
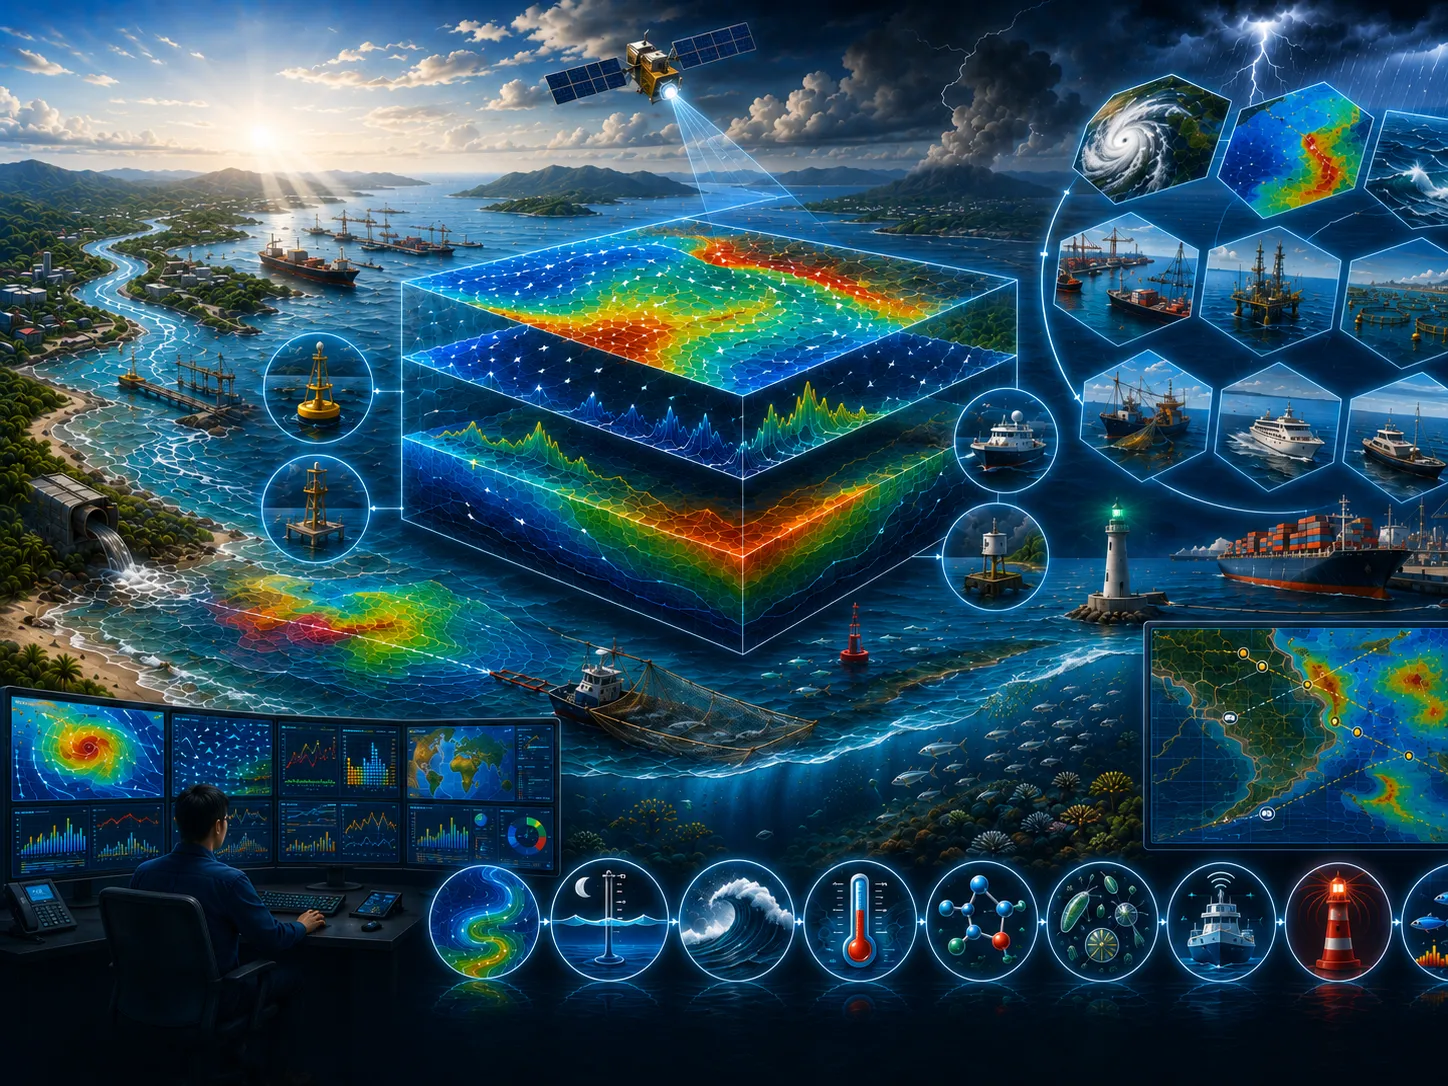
Model setup, calibration, validation, existing–planned–extreme scenarios, and sensitivity analysis.
Metadata, quality controls, assumptions, limitations, data versions, and processing lineage are documented.
Objectives, study area, available data, additional needs, initial risks, and recommended level of detail.
Quality-controlled data, thematic maps, time series, indicators, and comparable visualizations.
Comparison of existing conditions, alternatives, extremes, sensitivities, consequences, and mitigation options.
Methods, results, limitations, recommendations, action priorities, and stakeholder presentation materials.
Assumptions, data, variability, and limitations are stated so decision risk is not hidden.
Alternative locations, designs, operations, or policies are assessed using consistent indicators.
Data needs and analysis depth are proportionate to risk so resources are used efficiently.
Findings and recommendations are transparent for technical, management, regulatory, and partner review.
Objectives, users, location, project phase, problems, constraints, and the decision to support.
Methods, data, surveys, models, schedule, team, deliverables, review gates, and resource estimate.
Collection, inspection, harmonization, documentation, and data-sufficiency assessment.
Processing, modeling, validation, option comparison, sensitivity, and risk evaluation.
Maps, report, executive brief, presentation, supporting data, and follow-up plan.
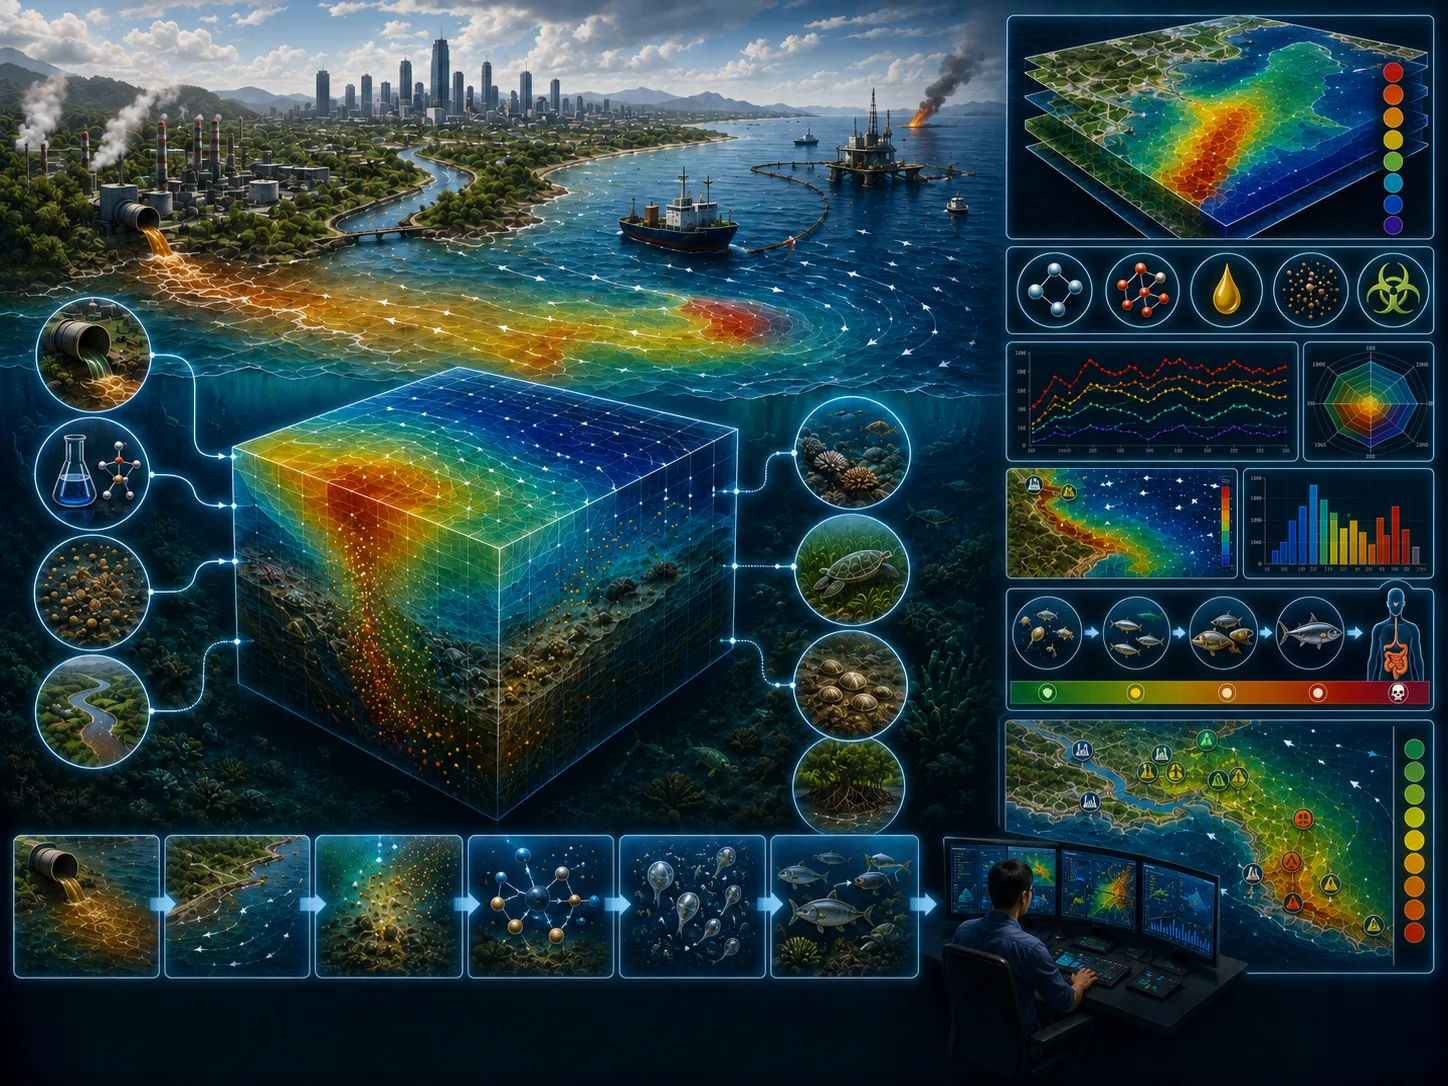
The aquatic environmental carrying capacity is the ability of a water body to receive a certain load of substances from external sources and naturally neutralize or restore environmental stability within a given period. This capacity has a finite limit, which may be defined by environmental regulations or determined from the actual environmental conditions of the water body. This threshold represents the maximum load that the aquatic system can sustain while maintaining ecological stability. Because every aquatic environment has unique physical, chemical, and biological characteristics, its carrying capacity also varies. Physical factors include hydrodynamic conditions such as water circulation, currents, and water levels; chemical factors include the composition of dissolved and suspended substances; and biological factors involve the organisms, habitats, and ecosystem interactions within the water body. Although these interactions are highly complex, advanced environmental modeling simplifies the system and provides a comprehensive understanding of how the entire aquatic environment functions.
Modeling scenarios for evaluating aquatic environmental carrying capacity are generally divided into two categories: natural (pristine) waters and human-impacted waters. For natural waters, modeling begins by characterizing the existing physical, chemical, and biological conditions and identifying the interactions among them. The key parameters influencing environmental carrying capacity are then quantified and simulated across a range of conditions, from minimum to extreme values. The objective is to determine the optimal threshold that maintains ecosystem stability without causing adverse effects on physical, chemical, or biological processes, particularly on aquatic organisms that support ecosystem functions. This optimal value serves as the natural baseline for evaluating future developments or pollutant discharges into the water body.
For human-impacted waters, the modeling approach begins by identifying physical, chemical, and biological parameters affected by existing human activities. Each parameter with the potential to disturb environmental stability is simulated to evaluate its environmental impact. The maximum acceptable pollutant load that the water body can naturally assimilate defines the anthropogenic carrying capacity threshold, while the natural threshold represents conditions under which no measurable human-induced disturbance occurs. Comparing these thresholds provides a scientific basis for environmental management, regulatory compliance, and sustainable coastal development.
The modeling framework integrates several specialized modules. The Hydrodynamic Model simulates water circulation patterns and water levels. The Advection–Dispersion Model predicts the transport and distribution of dissolved chemical constituents. Suspended Sediment Transport and Particle Tracking Models simulate the movement of sediment-associated contaminants. An Oil Spill Analysis Model is incorporated where accidental or chronic oil pollution poses a significant risk. The Ecosystem Model evaluates the interactions among physical, chemical, and biological processes that determine environmental carrying capacity. A Marine GIS Model integrates simulation results with spatial datasets to produce environmental carrying capacity maps for decision-making. Where estuarine systems are involved, the River Flow Model is used to simulate freshwater inflow and its influence on the aquatic environment.
Chemical parameters play a critical role in maintaining the chemical balance of aquatic environments.
Learn more →Aquatic habitat is the environment in which marine organisms live and carry out their life processes.
Learn more →Pollutant discharges from human activities entering aquatic systems exhibit different levels of environmental sensitivity in different water bodies, even when the pollutants have the same concentration and…
Learn more →The CORZ team will review the objective, scope, data availability, risk level, schedule, and required outputs to prepare a proportionate approach.
Share the location, objectives, key challenges, available data, and expected outputs. The CORZ team will help define a proportionate technical approach.