CORZ Indonesia | Research & Studies
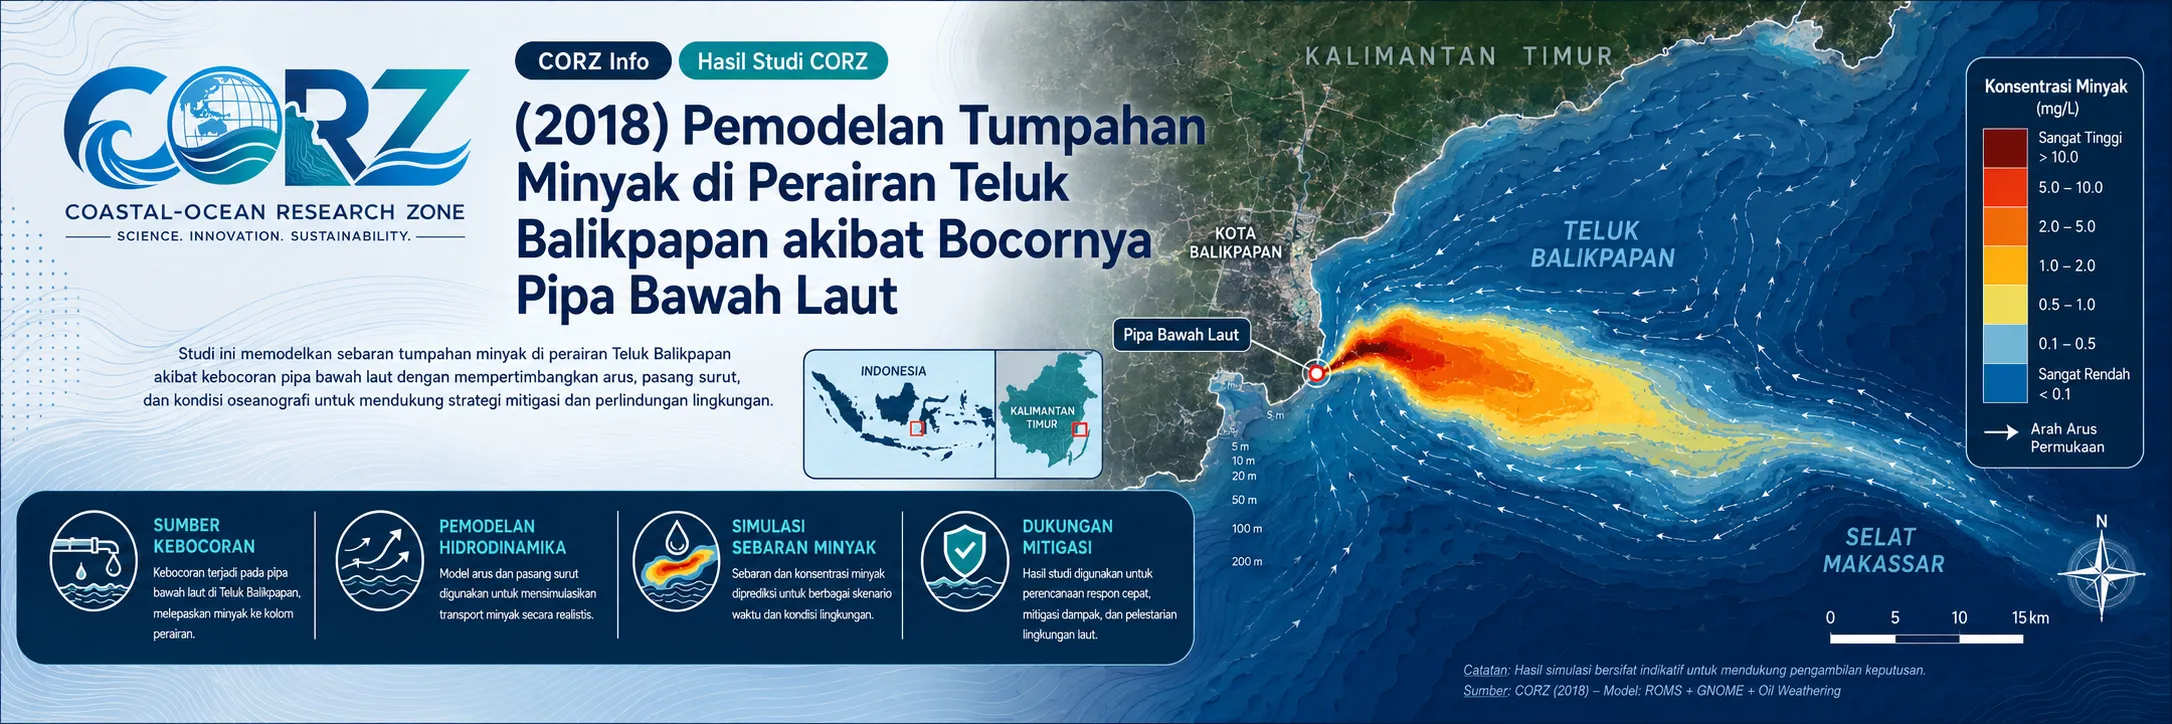
From a Subsea Pipeline Rupture to the Shorelines of Balikpapan Bay
Check out some other model outputs on YouTube @CORZIndonesia
In the early hours of 31 March 2018, a major incident transformed the waters of Balikpapan Bay.
Crude oil entered the marine environment following damage to the subsea pipeline connecting the Lawe-Lawe Terminal in North Penajam Paser with the Balikpapan refinery.
Pertamina subsequently confirmed that the source was a 20-inch subsea pipeline located at approximately 25 metres water depth.
The Jakarta Post — Burst undersea pipeline caused Balikpapan oil spill
Reuters reported that the incident prompted a major clean-up operation and an emergency declaration in Balikpapan as authorities worked to contain the spreading oil.
For oil-spill science, the problem immediately changed from:
“Could an oil spill occur?”
to:
Where will the released oil travel?
Which shorelines are hydrodynamically connected to the source?
When could particular coastal locations become exposed?
How will Balikpapan Bay currents transport the slick?
And how might exposure differ from one shoreline to another?
In 2018, CORZ Indonesia conducted Research & Studies involving oil-spill modelling of the Balikpapan Bay subsea-pipeline leakage event.
The assessment extended from a bay-wide simulation to a series of specific shoreline locations:
BAY-SCALE MODELLING
- Subsea Pipeline Oil Spill — Balikpapan Bay
SHORELINE-SPECIFIC MODELLING
- AURI Beach
• Bandara Lama Beach
• Banua Patra Beach
• Kampung Baru Beach
• Kariangau Beach
• KBC Haren Beach
• Klandasan Beach
• Margasari Beach
• Melawai Beach
• Nipah Beach
• Penajam Beach
• Wisma Sagara Beach
The analytical pathway therefore becomes:
SOURCE → BAY → SHORELINE.
When a Point Release Becomes a Bay-Wide Problem
A pipeline rupture occurs at a specific location.
Once oil enters the sea, however, the source coordinate is only the beginning.
The oil begins interacting with:
CURRENTS + TIDES + WIND + OIL PROPERTIES + TIME
Conceptually:
SUBSEA PIPELINE LEAK
↓
OIL RELEASE
↓
HYDRODYNAMIC TRANSPORT
↓
ADVECTION & SPREADING
↓
OIL-SLICK TRAJECTORY
↓
COASTAL EXPOSURE
↓
SHORELINE IMPACT POTENTIAL
The critical question becomes:
what does the ocean do with the oil after it enters the water?
Field Reports Demonstrated the Shoreline Dimension
The 2018 event rapidly became a shoreline problem.
ANTARA reported that the slick expanded from its initial location toward the Makassar Strait and contaminated coastal areas including Banua Patra Beach.
On the opposite side of the bay, ANTARA reported contamination extending approximately 13.9 km along the Penajam coast toward Buluminung, describing the oil as having been carried by marine currents.
The Jakarta Post also documented oil contamination and clean-up operations at Melawai and Banua Patra.
These observations are external field context, not numerical results from the CORZ model.
They demonstrate why an oil-spill assessment should not stop at an open-water slick trajectory.
CORZ Research: From One Regional Model to Multiple Coastal Receptors
A bay-wide model answers the broad question:
“Where can the spill travel?”
But emergency and environmental management requires another level of information:
What about this particular shoreline?
CORZ therefore extended the modelling concept toward specific coastal receptors.
The workflow becomes:
PIPELINE SOURCE
↓
BAY-WIDE OIL-SPILL MODEL
↓
TRAJECTORY ANALYSIS
↓
SHORELINE RECEPTORS
↓
LOCATION-SPECIFIC EXPOSURE ANALYSIS
This connects a single source with multiple vulnerable or operationally important coastal locations.
Bay-Wide Oil Spill Modelling
The regional Balikpapan Bay simulation provides the overall physical framework.
At this scale, modelling can support examination of:
- slick movement away from the source;
- dominant transport pathways;
- temporal development of the spill;
- hydrodynamic connections between inner and outer bay waters;
- potential approaches toward shorelines; and
- areas requiring higher-resolution analysis.
The bay-scale question is:
“Where can the spill go?”
Shoreline-Specific Modelling
The individual shoreline simulations then ask a more practical question:
“How is this particular shoreline connected to the spill?”
The model framework was applied to:
AURI • Bandara Lama • Banua Patra • Kampung Baru • Kariangau • KBC Haren • Klandasan • Margasari • Melawai • Nipah • Penajam • Wisma Sagara
Each coastal receptor has a different location relative to the circulation system.
Therefore:
geometric distance alone is not sufficient.
A more important consideration is:
HYDRODYNAMIC CONNECTIVITY.
Why Distance from the Spill Is Not Enough
The closest shoreline does not necessarily have to be the first shoreline reached.
Oil follows moving water rather than a ruler drawn across a map.
Conceptually:
DISTANCE FROM SOURCE ≠ EXPOSURE
Instead:
SOURCE LOCATION
+
CURRENT DIRECTION
+
CURRENT VELOCITY
+
TIME
+
OIL BEHAVIOUR
determine the evolving trajectory.
This is why numerical modelling can provide substantially more insight than a simple buffer around the accident location.
From Source-Based to Receptor-Based Modelling
Oil-spill analysis can be approached from two complementary directions.
SOURCE-BASED QUESTION
Where will oil released from the pipeline go?
and:
RECEPTOR-BASED QUESTION
How could the modelled spill interact with each shoreline?
Combining both produces:
SOURCE → TRAJECTORY → RECEPTOR
This is a far more operationally useful framework for emergency preparedness and shoreline protection.
The Scale of the 2018 Incident
Investigations continued throughout April 2018.
ANTARA reported underwater inspection of the broken pipeline, while an Indonesian Navy hydrographic investigation later identified an approximately 499-metre seabed trench believed to have resulted from anchor dragging associated with the pipeline incident.
detikNews reported Pertamina's preliminary estimate that approximately 40,000 barrels of crude oil may have been released, while noting that the detailed amount still depended on the continuing investigation.
ANTARA subsequently reported widespread contamination affecting coastal settlements and mangrove environments in Balikpapan and Penajam.
Such a scale demonstrates why a major incident requires more than a single static spill map.
From Trajectory Modelling to Emergency Response Intelligence
During an active spill, response teams need operational answers.
Where should oil booms be prioritised?
Which shorelines should be monitored first?
Where should clean-up teams be positioned?
Which sensitive areas may require protection?
Where should field samples be collected?
Numerical modelling can support the chain:
SOURCE LOCATION
↓
OCEAN FORCING
↓
OIL-SPILL TRAJECTORY
↓
SHORELINE RECEPTORS
↓
POTENTIAL EXPOSURE SEQUENCE
↓
RESPONSE PRIORITISATION
In real operations, this information should be integrated with:
satellite imagery • aerial surveillance • field observations • sampling • meteorological data • incident reports.
A model does not replace observations.
It helps direct them.
One Spill, Many Types of Shoreline
Balikpapan Bay contains many different coastal functions:
urban shoreline • residential waterfront • industrial coast • port environment • fishing communities • mangroves • recreational beaches
A single oil-spill trajectory can therefore interact with very different receptors.
This makes shoreline-specific modelling valuable because:
environmental consequence depends not only on where the oil travels, but on what it reaches.
From a Bay Model to a Shoreline Network
One of the strongest features of the 2018 CORZ study is the transition from:
BAY-SCALE UNDERSTANDING
to:
SHORELINE-SCALE QUESTIONS.
The bay model shows the overall movement.
The shoreline models translate that movement into location-specific environmental and response questions.
The result is no longer simply:
an oil-spill trajectory.
It becomes:
a network of potential shoreline exposure.
From Incident Reconstruction to Future Preparedness
The 2018 Balikpapan Bay case demonstrates the need for integrated capabilities in a coastal environment containing:
refineries • subsea pipelines • ports • tankers • ferries • industries • fisheries • settlements • mangroves
Oil-spill modelling can support:
- Oil Spill Contingency Planning
• Subsea Pipeline Risk Assessment
• Emergency Response Planning
• Shoreline Protection Strategy
• Sensitive-Area Mapping
• Environmental Impact Assessment
• Marine Pollution Assessment
• Port & Industrial Environmental Management
• Post-Spill Reconstruction and Analysis
Model the Spill. Track the Path. Protect the Shore.
A pipeline releases the oil.
The bay receives it.
Currents determine what happens next.
The shore becomes the receptor.
The 2018 Balikpapan Bay study reflects a CORZ Indonesia Research & Studies approach built around the complete chain:
Identify the Source.
Model the Hydrodynamics.
Track the Spill.
Follow the Trajectory.
Evaluate Every Shoreline.
Support the Response.
Protect What Matters.
Because during an oil spill, the most important question is not only:
“Where is the oil now?”
It is also:
“Which shoreline could it reach next?”
CORZ Indonesia for Research & Studies
Oil Spill Modelling • Subsea Pipeline Spill Assessment • Hydrodynamic Modelling • Shoreline Exposure Analysis • Emergency Response Support • Marine Pollution & Environmental Risk
Coastal-Ocean Research Zone (CORZ) Indonesia provides research, modelling, analysis, and technical solutions for coastal and ocean environments.
YouTube: https://www.youtube.com/@CORZIndonesia
Website: https://corz.co.id
Email: info@corz.co.id
© 2026 CORZ Indonesia. All Rights Reserved.