CORZ Indonesia | Research & Studies
Montara 2009: When an Offshore Incident Became a Transboundary Marine Issue
Check out some other model outputs on YouTube @CORZIndonesia
On 21 August 2009, a major offshore incident began at the Montara oil field in the Timor Sea.
A blowout at the H1 well resulted in an uncontrolled release of oil and gas into the marine environment. The discharge continued for 74 days before the well was brought under control in early November, making Montara one of Australia's most serious offshore oil-spill incidents.
Contemporary reporting by Associated Press through The Guardian described a ten-week struggle to stop the release and growing concern about threats to marine wildlife across the Timor Sea.
For marine scientists and environmental decision-makers, an incident of this scale raises questions far beyond:
“How much oil was released?”
More important questions include:
Where did the oil travel?
Which areas were repeatedly exposed?
How long could individual areas remain exposed?
Where was the greatest modelled oil load distributed?
And how could ocean circulation connect an offshore source with environments far from the original incident?
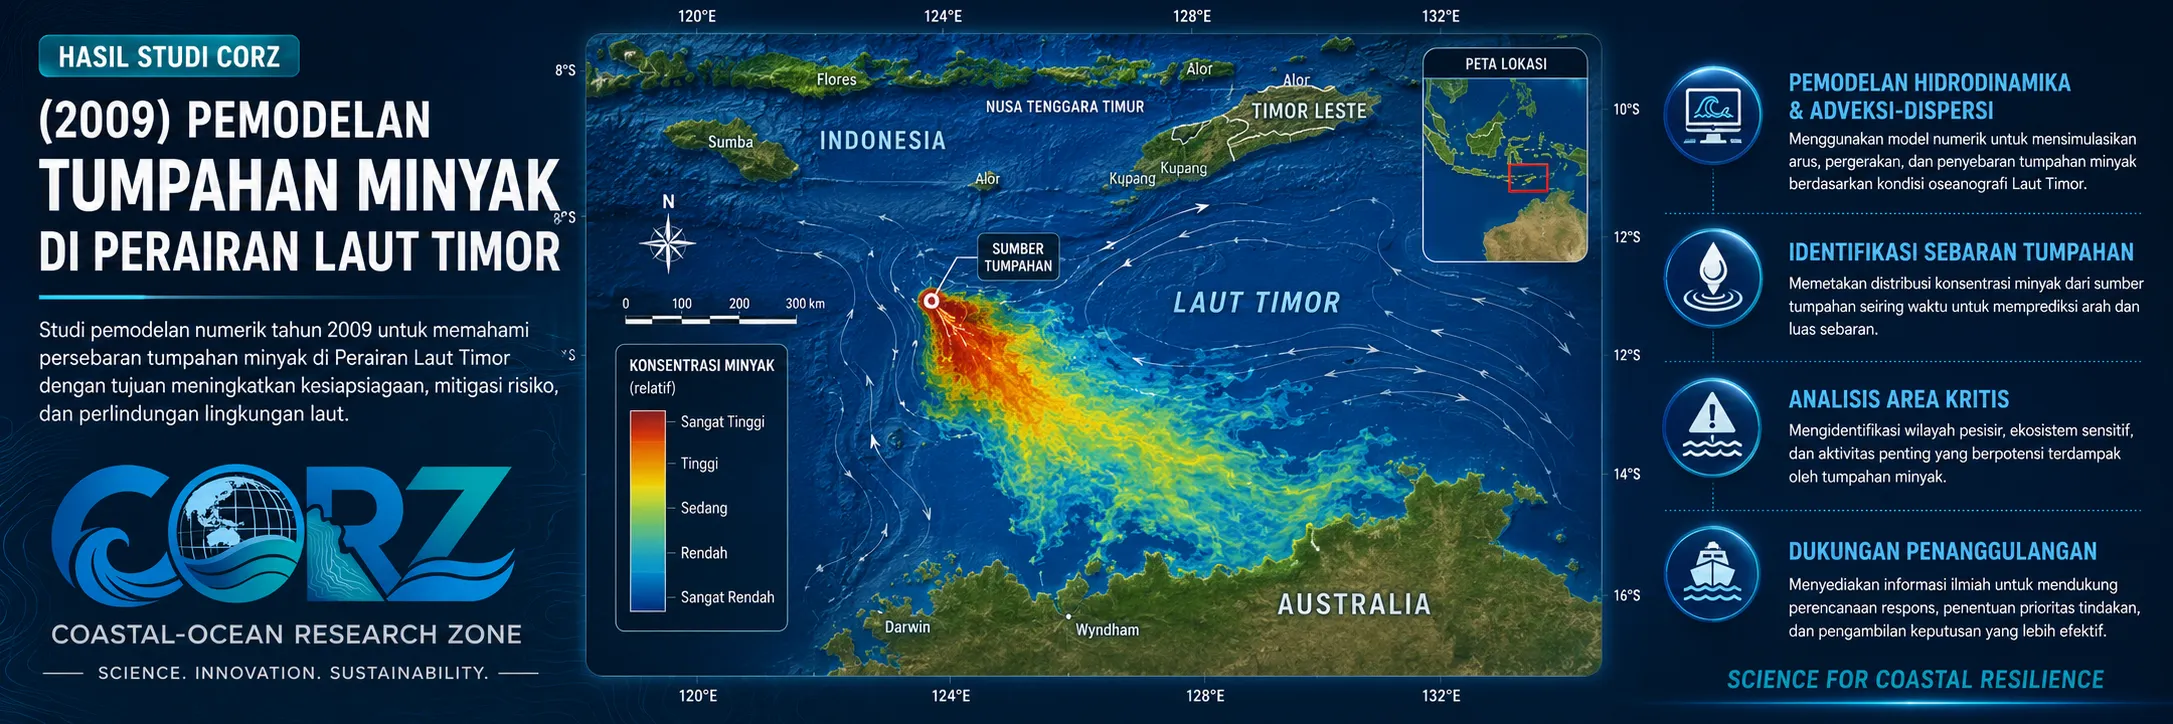
In 2009, CORZ Indonesia conducted Research & Studies involving numerical oil-spill modelling of the Montara offshore platform incident in the Timor Sea.
The study focused on three principal modelling outputs:
- Oil Spill Modelling — Exceedance Frequency
• Oil Spill Modelling — Exposure Duration
• Oil Spill Modelling — Total Oil
Each output provides a different perspective on the same pollution event.
Together, they transform a spill trajectory into a broader exposure and environmental-risk assessment.
From a Single Offshore Source to a Regional Marine System
An offshore oil spill does not remain at the platform.
Once petroleum enters the sea, its movement becomes governed by interactions among:
SOURCE + CURRENTS + WIND + DISPERSION + OIL PROPERTIES + TIME
Conceptually:
MONTARA OIL RELEASE
↓
HYDRODYNAMIC & METEOROLOGICAL FORCING
↓
TRANSPORT & DISPERSION
↓
OIL-SPILL TRAJECTORY
↓
EXPOSURE
↓
POTENTIAL ENVIRONMENTAL IMPACT
Numerical modelling enables the event to be investigated across:
SPACE × TIME × EXPOSURE
A point-source accident can therefore be analysed as a regional marine-pollution system.
- Exceedance Frequency: Where Could Exposure Recur?
The first CORZ modelling component was:
Oil Spill Modelling — Exceedance Frequency
Within probabilistic or multi-scenario oil-spill modelling, exceedance frequency can represent how frequently a particular location exceeds a specified exposure criterion or threshold defined within the model configuration.
The specific threshold used in this study is not presented here, and no value is therefore assumed.
The more important concept is the question that the analysis addresses:
“Which areas repeatedly appear under an oil-exposure condition within the modelled scenarios?”
An exceedance-frequency map therefore moves beyond a single trajectory.
It helps reveal spatial patterns where modelled exposure occurs more consistently or more frequently.
Such information can support:
monitoring priorities • identification of sensitive areas • contingency planning • response-resource allocation • environmental risk assessment
- Exposure Duration: Because Not Every Exposure Lasts the Same Length of Time
The second component was:
Oil Spill Modelling — Exposure Duration
Two areas may both experience oil exposure.
Yet the environmental significance may be very different.
One location may be affected briefly, while another may remain under the defined exposure condition for a substantially longer period.
Understanding:
WHERE THE OIL GOES
is therefore not enough.
We also need to understand:
HOW LONG THE EXPOSURE LASTS.
Exposure-duration modelling provides a spatial representation of the period for which a location remains under the exposure condition defined by the model.
This matters because time is a fundamental dimension of environmental risk.
Conceptually:
EXPOSURE = LOCATION × CONCENTRATION/THRESHOLD × TIME
Adding duration transforms trajectory analysis into a more complete environmental-exposure assessment.
- Total Oil: Understanding the Overall Distribution of Oil
The third component was:
Oil Spill Modelling — Total Oil
If exceedance frequency addresses how frequently exposure occurs and exposure duration describes how long it persists, Total Oil provides another perspective on the overall distribution of oil represented within the model.
The parameter can help illustrate how modelled oil load is distributed throughout the simulation domain according to the formulation and units adopted in the numerical model.
The three outputs therefore answer complementary questions:
EXCEEDANCE FREQUENCY
How often?
EXPOSURE DURATION
How long?
TOTAL OIL
How much oil load is represented?
And together:
WHERE?
This multi-parameter approach provides substantially more information than trajectory alone.
Beyond Trajectory: Towards Exposure Mapping
Oil-spill modelling is often visualised as an animated slick moving across a map.
The CORZ Montara study goes further.
Combining Exceedance Frequency + Exposure Duration + Total Oil develops the simulation into:
TRAJECTORY
↓
SPATIAL DISTRIBUTION
↓
REPEATED EXPOSURE
↓
EXPOSURE DURATION
↓
OIL LOAD
↓
ENVIRONMENTAL RISK INFORMATION
The model therefore does not merely show the journey of the oil.
It helps characterise the exposure left along that journey.
When Modelling Meets the Real Timor Sea
The scale and complexity of the Montara issue became increasingly apparent after the incident.
In February 2010, ABC News reported laboratory analysis of samples collected near West Timor that were found to be similar to Montara crude, contributing to the continuing debate over whether the spill had entered Indonesian waters.
ABC News — Timor Sea oil leak reached Indonesia
In 2014, ABC reported that the Indonesian government had formally requested Australian cooperation in resolving the dispute over impacts on Indonesian coastal communities.
ABC News — Indonesia requests Australian cooperation over Montara oil spill
The issue eventually became the subject of long-running legal proceedings.
On 19 March 2021, the Federal Court of Australia upheld the claim of Rote Island seaweed farmer Daniel Sanda. The court found that oil from the H1 well blowout reached certain Indonesian areas and caused or materially contributed to damage to his seaweed crop. ABC reported the decision in the context of claims involving thousands of Indonesian seaweed farmers.
ABC News — Indonesian seaweed farmers gain compensation over Montara oil spill
The history demonstrates why questions of:
where • how often • how long • how much
are critical in major marine-pollution assessments.
From a Local Incident to Transboundary Marine Pollution
Montara also demonstrated the geographical complexity of marine pollution.
The source was an offshore petroleum facility.
The ocean, however, does not recognise the administrative boundaries drawn on a map.
Marine circulation can connect:
OFFSHORE FIELD → OPEN SEA → MARITIME BOUNDARIES → FISHING GROUNDS → COASTAL COMMUNITIES
In October 2009, The Guardian reported concerns over the extensive slick and risks to dolphins, seabirds, turtles, sea snakes, and other marine wildlife in the Timor Sea.
The Guardian — Australian oil spill contaminating one of world's richest marine wildernesses
More than a decade later, mainstream reporting continued to document the social and economic consequences Indonesian coastal communities associated with the disaster.
Montara illustrates a fundamental principle:
Marine pollution may originate locally, but ocean circulation can make its consequences regional.
Why Do These Three Parameters Matter for Decision Support?
Imagine a map of an oil spill.
Knowing where oil is located is only the first layer of information.
Decision-makers may also need to ask:
Does a location experience exposure once or repeatedly?
→ Exceedance Frequency
How long does that exposure persist?
→ Exposure Duration
How is the overall modelled oil distributed?
→ Total Oil
Combining these information layers can strengthen:
- Oil Spill Contingency Planning
• Transboundary Pollution Assessment
• Emergency Response Planning
• Offshore Oil & Gas Environmental Studies
• Environmental Impact Assessment (EIA)
• Marine Environmental Risk Assessment
• Sensitive Ecosystem Protection
• Fisheries & Coastal Exposure Studies
From Data to Environmental Intelligence
At CORZ Indonesia, a model is not simply a visualisation tool.
It is a method for transforming data into environmental intelligence.
The workflow can be expressed as:
INCIDENT / RELEASE DATA
↓
OCEAN & ATMOSPHERIC FORCING
↓
HYDRODYNAMIC MODEL
↓
OIL-SPILL MODEL
↓
TRAJECTORY
↓
EXCEEDANCE FREQUENCY
↓
EXPOSURE DURATION
↓
TOTAL OIL
↓
ENVIRONMENTAL DECISION SUPPORT
The more complex the pollution problem, the more important it becomes to move beyond a single map or animation.
Montara 2009: A Lesson from an Ocean Without Borders
The Montara incident demonstrates how an offshore well failure can evolve into an issue involving:
environment • fisheries • economics • international relations • law • coastal livelihoods.
That is why marine-pollution modelling matters.
A numerical model cannot prevent mechanical failure at an offshore platform.
But it can help us understand:
what the ocean may do with the oil after that failure occurs.
And that understanding can support better preparedness and better decisions.
Model the Exposure—not Just the Spill.
The 2009 Montara study reflects a CORZ Indonesia approach that moves beyond simply asking where an oil slick travels.
Track the Oil.
Measure the Exposure.
Understand the Duration.
Map the Risk.
Support Better Decisions.
Because in a major oil spill:
It is not only where the oil goes that matters.
It is how often, how long, and how much.
CORZ Indonesia for Research & Studies
Oil Spill Modelling • Exceedance Frequency Analysis • Exposure Assessment • Offshore Environmental Studies • Marine Pollution • Transboundary Pollution Assessment • Environmental Risk Modelling
Coastal-Ocean Research Zone (CORZ) Indonesia provides research, modelling, analysis, and technical solutions for coastal and ocean environments.
YouTube: https://www.youtube.com/@CORZIndonesia
Website: https://corz.co.id
Email: info@corz.co.id
© 2026 CORZ Indonesia. All Rights Reserved.