


CONTEXTField conditions and systems being assessed
Enter at least two characters.
Select one type of model module to view the studies and assessments that have been conducted using modeling technology.


Clarity before a decision is made
Select one type of model module to view the studies and assessments that have been conducted using modeling technology.
Setelah diklik dan dipilih jenis modul modelnya (misalkan memilih mengklik: ”Pergerakan Sedimen Dasar” terdapat sebanyak dua studi dan kajian), maka akan muncul tabel sebagai berikut:
Define the approach, priorities, and actions for modeling modules using traceable evidence.
Using non-comparable references or applying results outside their context.
Studies are traceable, comparable, and useful as an initial reference.

This aspect is assessed to clarify its implications for modeling modules.
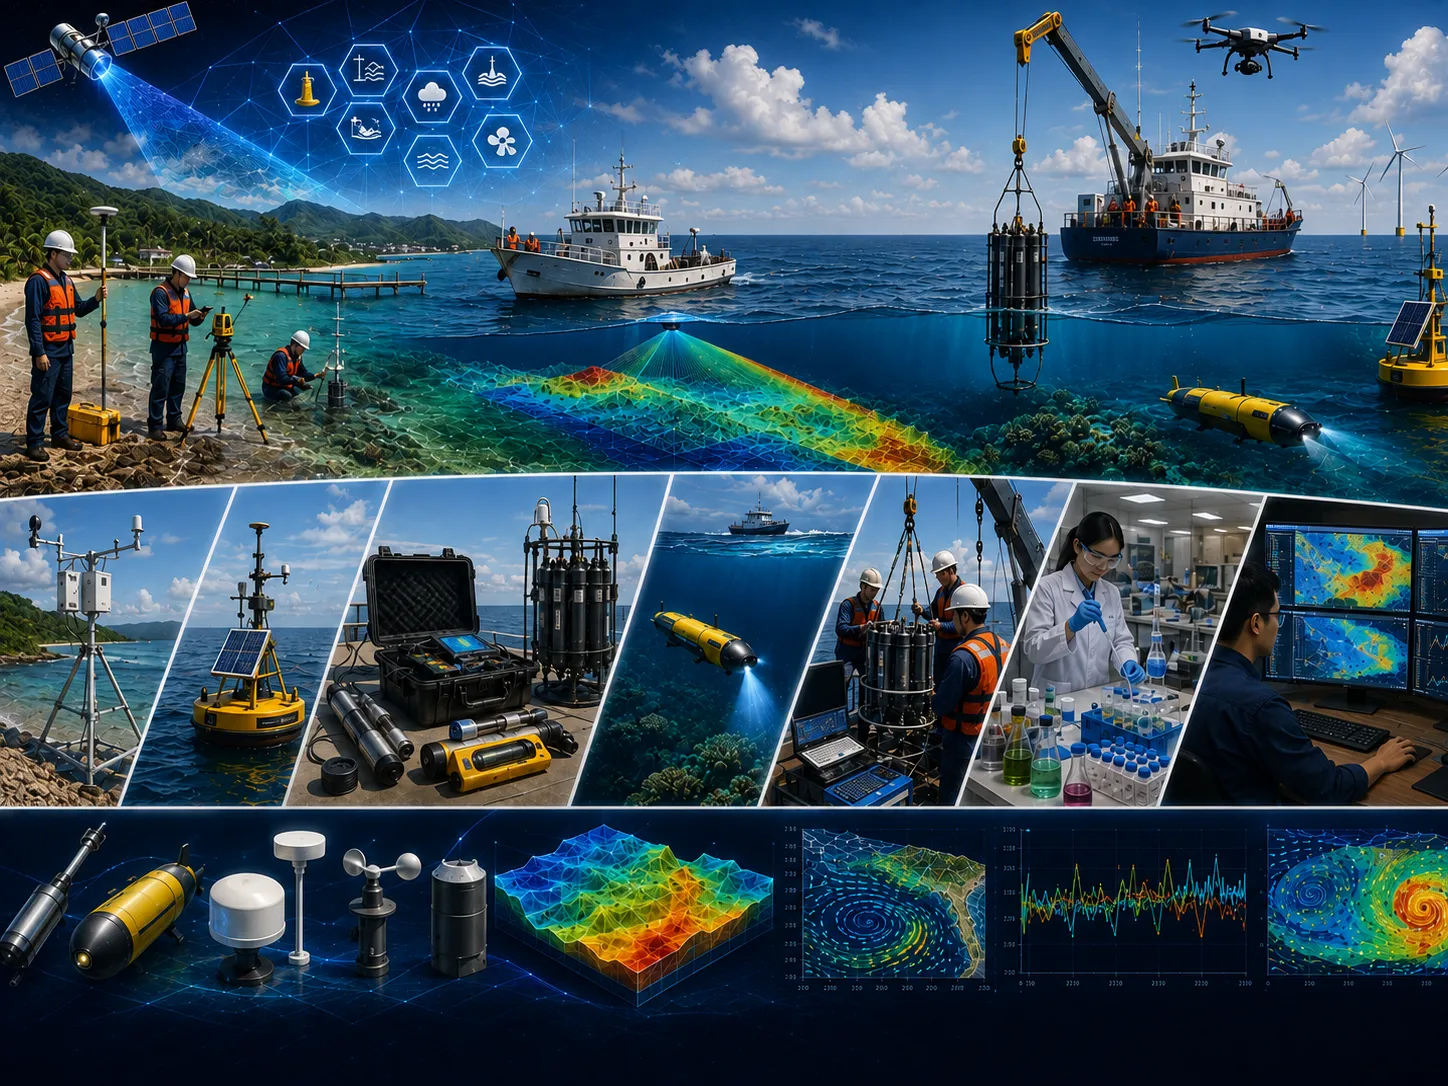
This aspect is assessed to clarify its implications for modeling modules.

This aspect is assessed to clarify its implications for modeling modules.

This aspect is assessed to clarify its implications for modeling modules.

This aspect is assessed to clarify its implications for modeling modules.

This aspect is assessed to clarify its implications for modeling modules.
Field surveys, in-situ measurements, laboratory results, historical records, and operating information as required.
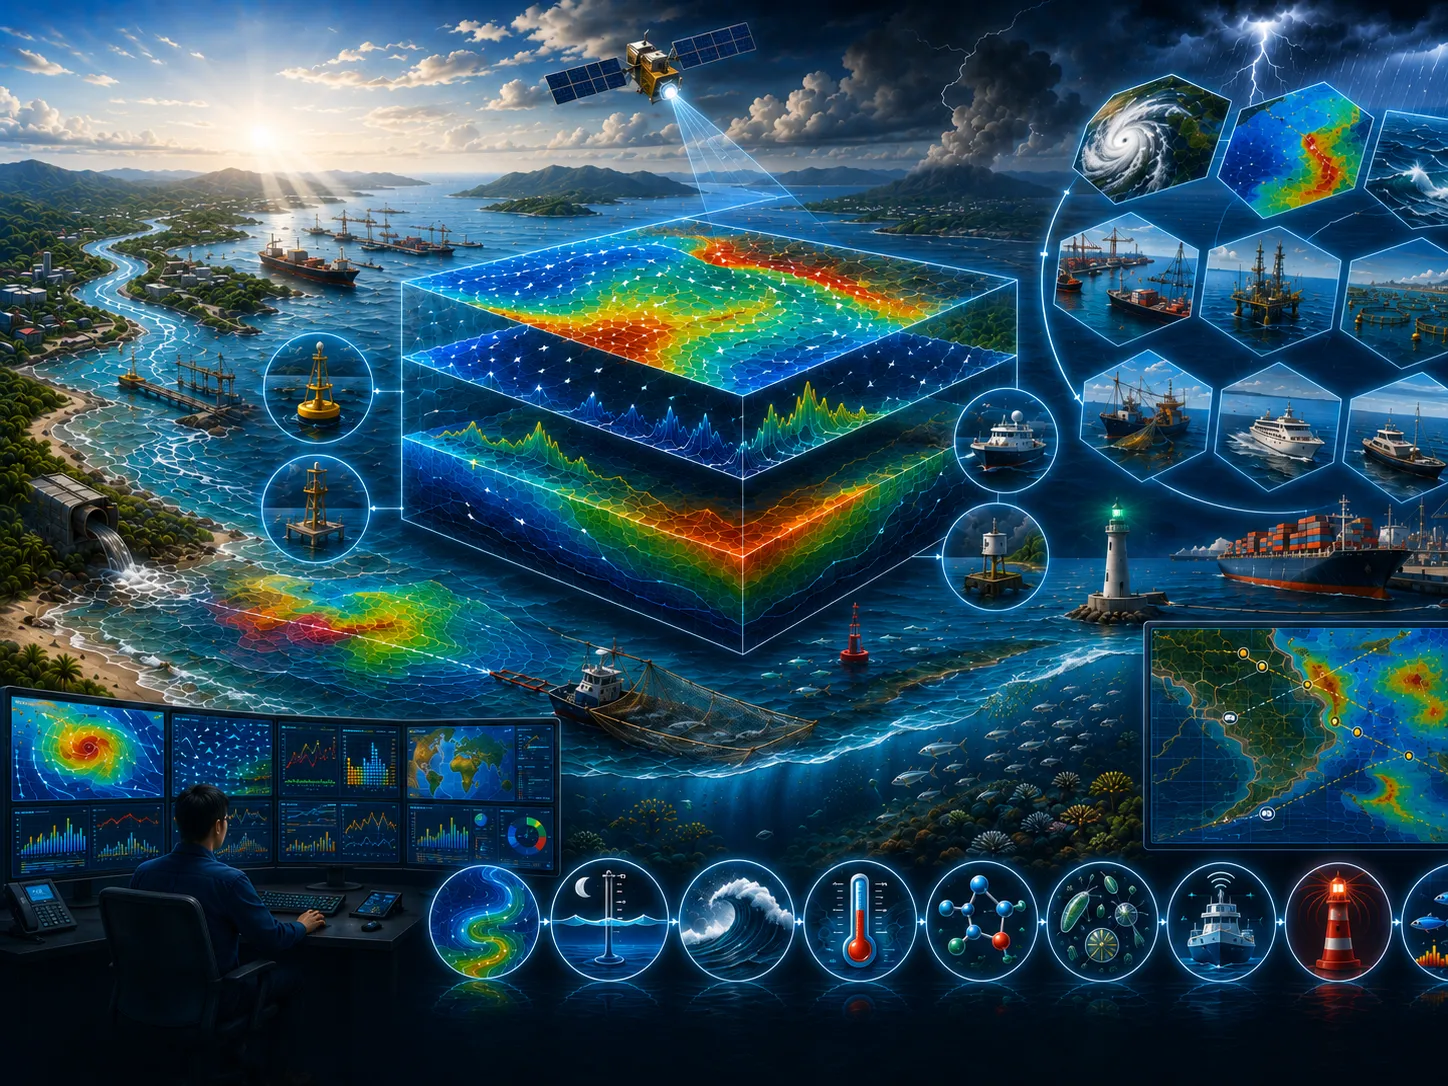
Satellite imagery, mapping, spatial analysis, temporal change, and integration of multiple data sources.

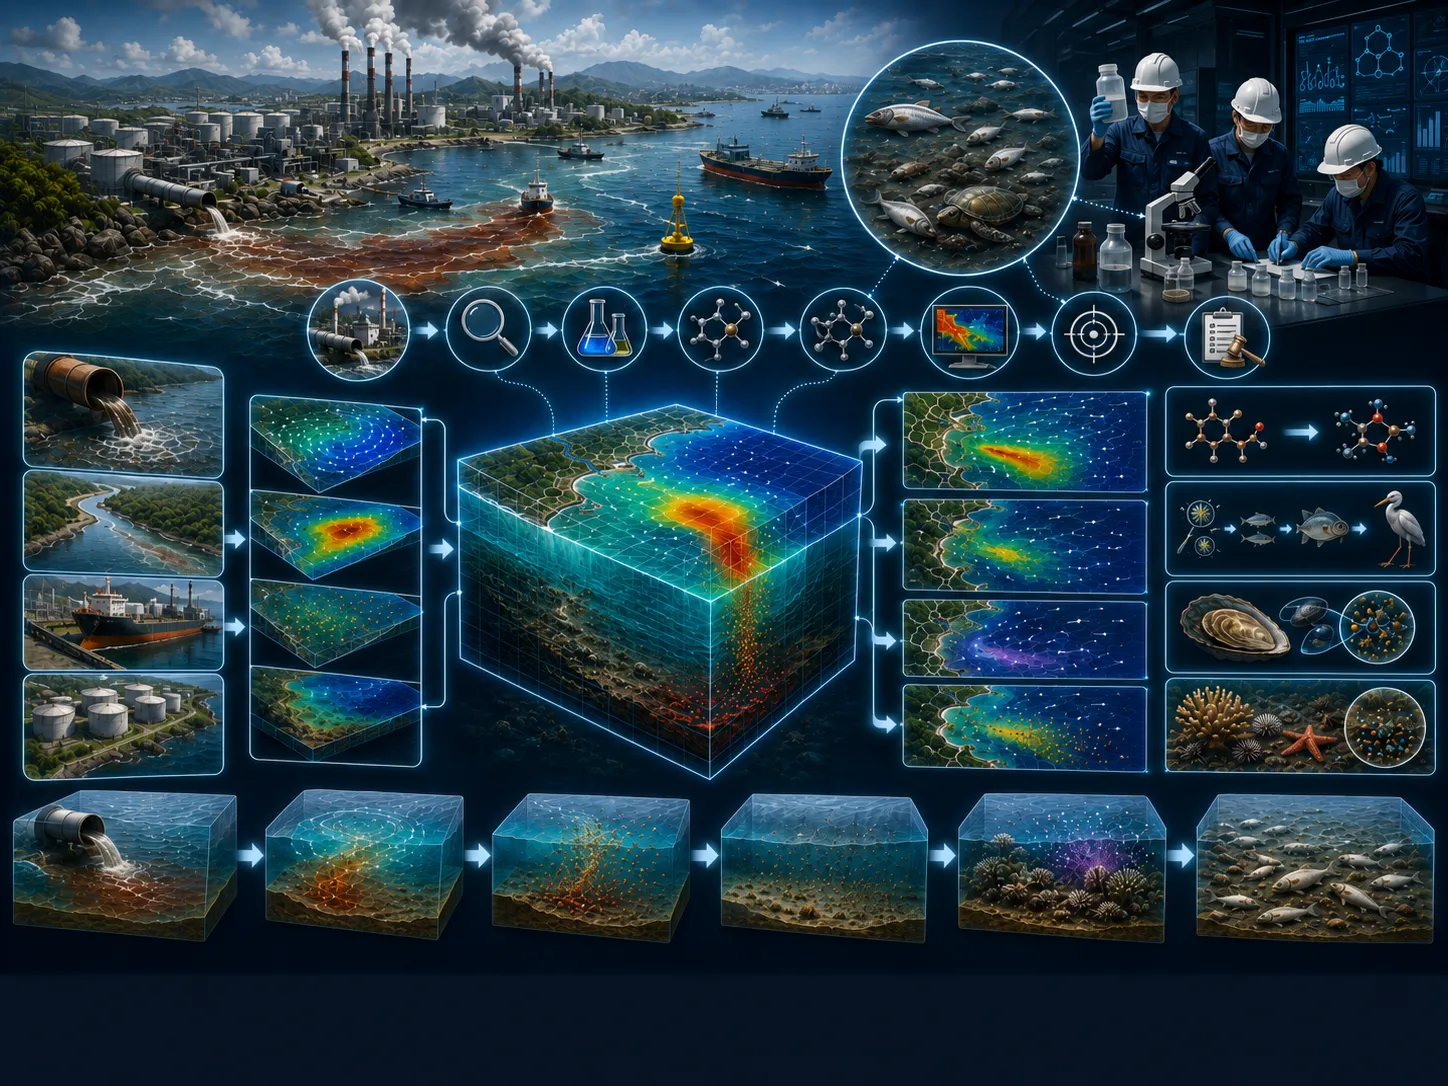
Model setup, calibration, validation, existing–planned–extreme scenarios, and sensitivity analysis.
Metadata, quality controls, assumptions, limitations, data versions, and processing lineage are documented.
Objectives, study area, available data, additional needs, initial risks, and recommended level of detail.
Quality-controlled data, thematic maps, time series, indicators, and comparable visualizations.
Comparison of existing conditions, alternatives, extremes, sensitivities, consequences, and mitigation options.
Methods, results, limitations, recommendations, action priorities, and stakeholder presentation materials.
Assumptions, data, variability, and limitations are stated so decision risk is not hidden.
Alternative locations, designs, operations, or policies are assessed using consistent indicators.
Data needs and analysis depth are proportionate to risk so resources are used efficiently.
Findings and recommendations are transparent for technical, management, regulatory, and partner review.
Objectives, users, location, project phase, problems, constraints, and the decision to support.
Methods, data, surveys, models, schedule, team, deliverables, review gates, and resource estimate.
Collection, inspection, harmonization, documentation, and data-sufficiency assessment.
Processing, modeling, validation, option comparison, sensitivity, and risk evaluation.
Maps, report, executive brief, presentation, supporting data, and follow-up plan.
Select one type of model module to view the studies and assessments that have been conducted using modeling technology. To do this, click the name of the model module in the table below.
Setelah diklik dan dipilih jenis modul modelnya (misalkan memilih mengklik: ”Pergerakan Sedimen Dasar” terdapat sebanyak dua studi dan kajian), maka akan muncul tabel sebagai berikut:
Select one of the studies or assessments from the Bed Sediment Transport model module type to view a summary of the results that have been conducted using modeling technology. To do this, click one of the titles in the table below.
Setelah memilih misalnya nomor dua, maka akan muncul (dari file ”Aplikasi (12 Okt 09).doc”):
Select one of the locations on the map to view the studies and assessments that have been conducted using modeling technology.
Learn more →Select one type of model application to view the studies and assessments that have been conducted using modeling technology.
Learn more →The CORZ team will review the objective, scope, data availability, risk level, schedule, and required outputs to prepare a proportionate approach.
Share the location, objectives, key challenges, available data, and expected outputs. The CORZ team will help define a proportionate technical approach.